NASA scientists say 2012 was the ninth warmest of any year since 1880, continuing a long-term trend of rising global temperatures.
With the exception of 1988, the nine warmest years in the 132-year record all have occurred since 2000, with 2010 and 2005 ranking as the hottest years on record.
NASA’s Goddard Institute for Space Studies (GISS) in New York, which monitors global surface temperatures on an ongoing basis, released an updated analysis Tuesday that compares temperatures around the globe in 2012 to the average global temperature from the mid-20th century.
The comparison shows how Earth continues to experience warmer temperatures than several decades ago.
NASA’s analysis of Earth’s surface temperature found that 2012 ranked as the ninth-warmest year since 1880. NASA scientists at the Goddard Institute for Space Studies (GISS) compare the average global temperature each year to the average from 1951 to 1980.
This 30-year period provides a baseline from which to measure the warming Earth has experienced due to increasing atmospheric levels of heat-trapping greenhouse gases. While 2012 was the ninth-warmest year on record, all 10 of the warmest years in the GISS analysis have occurred since 1998, continuing a trend of temperatures well above the mid-20th century average.
The record dates back to 1880 because that is when there were enough meteorological stations around the world to provide global temperature data.
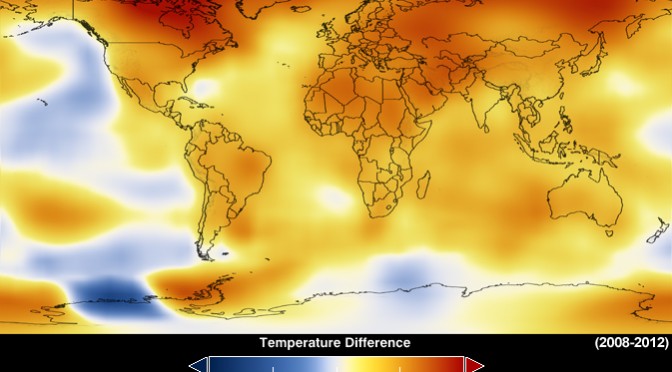
This map represents global temperature anomalies averaged from 2008 through 2012. Data source: NASA Goddard Institute for Space Studies. Visualization credit: NASA Goddard’s Scientific Visualization Studio.
The average temperature in 2012 was about 58.3 degrees Fahrenheit (14.6°Celsius), which is 1.0°F (0.6°C) warmer than the mid-20th century baseline. The average global temperature has risen about 1.4°F (0.8°C) since 1880, according to the new analysis.
Scientists emphasize that weather patterns always will cause fluctuations in average temperature from year to year, but the continued increase in greenhouse gas levels in Earth’s atmosphere assures a long-term rise in global temperatures. Each successive year will not necessarily be warmer than the year before, but on the current course of greenhouse gas increases, scientists expect each successive decade to be warmer than the previous decade.
“One more year of numbers isn’t in itself significant,” GISS climatologist Gavin Schmidt said. “What matters is this decade is warmer than the last decade, and that decade was warmer than the decade before. The planet is warming. The reason it’s warming is because we are pumping increasing amounts of carbon dioxide into the atmosphere.”
Carbon dioxide is a greenhouse gas that traps heat and largely controls Earth’s climate. It occurs naturally and also is emitted by the burning of fossil fuels for energy. Driven by increasing man-made emissions, the level of carbon dioxide in Earth’s atmosphere has been rising consistently for decades.
The carbon dioxide level in the atmosphere was about 285 parts per million in 1880, the first year in the GISS temperature record. By 1960, the atmospheric carbon dioxide concentration, measured at NOAA’s Mauna Loa Observatory, was about 315 parts per million. Today, that measurement exceeds 390 parts per million.
While the globe experienced relatively warm temperatures in 2012, the continental U.S. endured its warmest year on record by far, according to NOAA, the official keeper of U.S. weather records.
“The U.S. temperatures in the summer of 2012 are an example of a new trend of outlying seasonal extremes that are warmer than the hottest seasonal temperatures of the mid-20th century,” GISS director James E. Hansen said. “The climate dice are now loaded. Some seasons still will be cooler than the long-term average, but the perceptive person should notice that the frequency of unusually warm extremes is increasing. It is the extremes that have the most impact on people and other life on the planet.”
The temperature analysis produced at GISS is compiled from weather data from more than 1,000 meteorological stations around the world, satellite observations of sea-surface temperature, and Antarctic research station measurements. A publicly available computer program is used to calculate the difference between surface temperature in a given month and the average temperature for the same place during 1951 to 1980. This three-decade period functions as a baseline for the analysis. The last year that experienced cooler temperatures than the 1951 to 1980 average was 1976.
The GISS temperature record is one of several global temperature analyses, along with those produced by the Met Office Hadley Centre in the United Kingdom and the National Oceanic and Atmospheric Administration’s National Climatic Data Center in Asheville, N.C. These three primary records use slightly different methods, but overall, their trends show close agreement.
Related Links
+ GISS Surface Temperature Analysis (GISTEMP)
+ Science Summary of NASA’s 2012 Temperature Analysis (pdf)
+ NOAA State of the Climate Global Analysis: 2012
+ Download related multimedia in broadcast-suitable HD formats
http://www.evwind.com/2013/01/27/las-energias-renovables-pueden-frenar-las-emisiones-de-co2/


