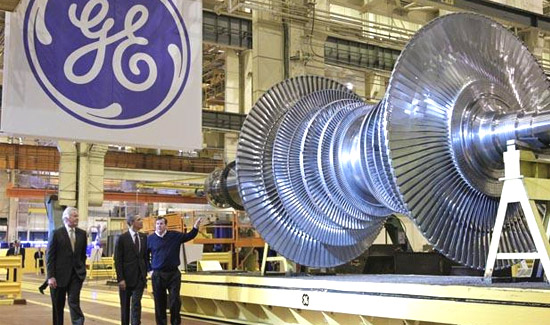
General Electric of the US and Vestas of Denmark were tied for pole position among turbine manufacturers in the world wind market in 2012 – a record year that saw 48.4GW of new capacity installed.
Research by Bloomberg New Energy Finance, published for clients today, finds that a surge of development activity in the US, where all projects had to be grid connected prior to year-end 2012 in order to qualify for its expiring tax credit, helped boost GE’s rankings, enabling it to catch up with established market leader Vestas. More than 96% of GE’s wind turbines commissioned in 2012 were in the US market.
The US wind installation boom – which has given way to a sharp contraction in that market in 2013 – also helped foreign manufacturers with a strong presence in that country to boost sales. European manufacturers such as Siemens and Gamesa had the US as their single largest market in 2012, according to the BNEF analysis. Even Vestas, which commissioned turbines in more markets than any other supplier, had 40% of its capacity additions of 2012 in the US.
Meanwhile the Chinese wind market saw an 18% drop in annual capacity added in 2012. This pushed the four largest Chinese turbine manufacturers to the bottom of the Top-10 rankings. Chinese manufacturers also stayed at home – more than 99% of turbines installed by Chinese manufacturers were in their domestic market, showing that they have much work to do if they are to take advantage of their low selling prices to penetrate export markets.
In 2013, fortunes are expected to reverse as Bloomberg New Energy Finance expects the US market to decline sharply while China stabilises and recovers. This will help Chinese manufacturers gain world market share at the expense of their Western competitors.
“2012 was a great year for Western manufacturers in terms of adding new capacity, particularly those with large exposure to the US market,” said Justin Wu, head of wind analysis at Bloomberg New Energy Finance. “Unfortunately, this boom was largely based on beating the deadline on an expiring subsidy and not on sustainable growth. As such, 2013 will look very different.” Wu added.
In total the world’s 10 largest wind turbine suppliers contributed 33.5GW, or nearly 70% of 2012’s total global commissioned capacity.
Bloomberg New Energy Finance’s ranking of the top 10 wind turbine manufacturers by commissioned capacity in 2012 is as follows:
1) GE (US) – 11.8%
2) Vestas (Denmark) – 11.8%
3) Siemens (Denmark) – 11.0%
4) Enercon (Germany) – 7.2%
5) Suzlon/REpower (India) – 6.6%
6) Gamesa (Spain) – 6.4%
7) Goldwind (China) – 6.0%
8) Guodian United Power (China) – 3.5%
9) Sinovel (China) – 2.7%
10) Sewind (China) – 2.3%
Also in 2012, China’s Guodian Corporation overtook Spanish utility Iberdrola to become the largest owner of operational wind assets in the world. Guodian owned 13.7GW of operating wind capacity at the end of 2012, while Iberdrola had 13.3GW. The gap will likely grow larger as Guodian maintains a large development pipeline, while Iberdrola is currently divesting its non-core wind assets.
Of the top 20 wind asset owners studied by Bloomberg New Energy Finance in its market shares report, nine are European, eight are Chinese and three are American. In total, the top 20 wind asset owners in the world own 108GW, or nearly 40% of the global total of 280GW.
Bloomberg New Energy Finance’s ranking of the top 20 wind asset owners in the world by cumulative capacity at year-end 2012 is as follows:
1) China Guodian Corporation (China) – 4.9%
2) Iberdrola (Spain) – 4.8%
3) NextEra Energy (US) – 3.7%
4) China Huaneng Group (China) – 2.8%
5) China Datang Corporation (China) – 2.6%
6) EDP (Portugal) – 2.3%
7) Acciona (Spain) – 1.9%
8) E.ON (Germany) – 1.7%
9) Enel (Italy) – 1.6%
10) EDF (France) – 1.5%
11) China Huadian Corporation (China) – 1.5%
12) Shenhua Group (China) – 1.5%
13) Berkshire Hathaway (US) – 1.3%
14) GDF Suez (France) – 1.3%
15) Guangdong Nuclear Power (China) – 1.2%
16) Invenergy (US) – 0.9%
17) China Resources National (China) – 0.9%
18) China Power Investment (China) – 0.8%
19) RWE (Germany) – 0.7%
20) SSE (UK) – 0.7%
In terms of market presence, European utilities were the most international, owning assets in more markets than their American or Chinese counterparts. American and Chinese wind owners, meanwhile, had nearly 100% of their assets within their respective home countries. This trend will likely change in the near future as Chinese utilities look to acquire more wind assets overseas.


