India’s share of renewable generation in the total electricity mix increased to around 6 per cent in the 2012/13 financial year – an amount the government is hoping to grow to 20 per cent by the end of 2020, to help meet the nation’s a peak power deficit of 12GW, or around 9 per cent of its demand.
“With electricity demand expected to grow and conventional power capacity facing its own challenges, we expect developers and investors to favour renewable capacity addition,” says the report, pointing to increasing constraints on new-build coal, gas and nuclear, as well as increasing levels of water stress.
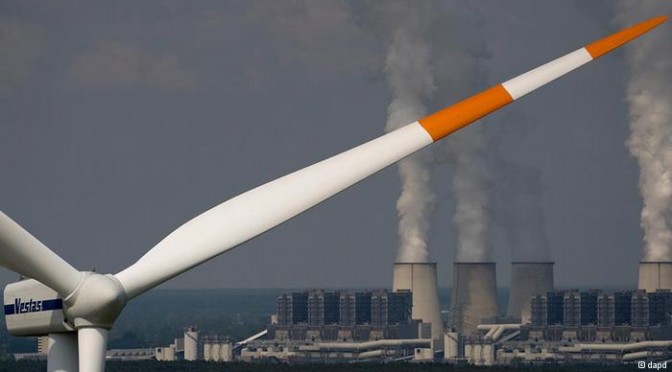
Wind energy is now cost competitive with new-build coal capacity in India, and solar is likely to follow suit sometime between 2016-18, according to a report by HSBC.

For wind, favourable policy support mechanisms, such as increased state tariffs (although most remain well below coal tariffs, as mentioned – chart 3) and the expected 2014 reintroduction of the government’s Generation Based Incentive for wind energy projects, are expected to help deliver what some say could be a potential capacity of more than 100GW to a few hundred GW – well above the 50GW the Indian government has long been forecasting.
“Over the past 12 months, across key wind states, except Karnataka, the wind tariff has been raised,” says the report. “Six key states – Andhra Pradesh, Gujarat, Madhya Pradesh, Maharashtra, Rajasthan and Tamil Nadu – have increased tariffs in the range of 2-36 per cent,” it says, while Karnataka’s wind tariff is due to be reviewed next year, and a few other states, like Kerala, have also increased tariffs.
For solar, HSBC says it is now forecasting grid parity for between 2016-18, two years earlier than its previous prediction of 2018-20. The report notes that the cost of solar systems has declined 70 per cent over 2008-12 – a decrease that is reflected in the solar tariff decline observed in India for solar projects over the past three years (see Chart 4).
The government is aiming to install around 10GW of solar from 2013-2016, including 3.6GW capacity under the Central Government (GoI) Program and another 5.4GW from the state programs. According to HSBC, India currently has 1.2GW of installed solar capacity and over 4GW of capacity is at various stages of tariff bidding.
To drive this growth, the government recently announced project developers would be likely to be paid $US11/kWh, and could also bid for capital support if needed, through mechanisms such as Viability Gap Funding, which – as stipulated in the draft of India’s National Solar Mission, Phase II – could cover up to 30 per cent of the cost of a project.
“Coal stress has been a key driver of renewables in India,” says the report. “We now see water stress as also supporting renewables growth. For the third consecutive year in a row, some coal-based capacity has been closed down during the pre-monsoon period driven by water shortages. We note that thermal power generation is the largest water consumer within the industry segment in India.”
For wind, favourable policy support mechanisms, such as increased state tariffs (although most remain well below coal tariffs, as mentioned – chart 3) and the expected 2014 reintroduction of the government’s Generation Based Incentive for wind energy projects, are expected to help deliver what some say could be a potential capacity of more than 100GW to a few hundred GW – well above the 50GW the Indian government has long been forecasting.
“Over the past 12 months, across key wind states, except Karnataka, the wind tariff has been raised,” says the report. “Six key states – Andhra Pradesh, Gujarat, Madhya Pradesh, Maharashtra, Rajasthan and Tamil Nadu – have increased tariffs in the range of 2-36 per cent,” it says, while Karnataka’s wind tariff is due to be reviewed next year, and a few other states, like Kerala, have also increased tariffs.
- End 1997: 940 MW
- End 1998: 992 MW (+5.6 %)
- End 1999: 1,035 MW (+4.4 %)
- End 2000: 1,267 MW (+22.5 %)
- End 2001: 1,507 MW (+19 %)
- End 2002: 1,702 MW (+13 %)
- End 2003: 2,110 MW (+24 %)
- End 2004: 3,000 MW (+42.2 %)
- End 2005: 4,430 MW (+47.7 %)
- End 2006: 6,270 MW (+41.6 %)
- End 2007: 7,850 MW (+25.2 %)
- End 2008: 9,587 MW (+22.2 %)
- End 2009: 10,926 MW (+14 %)
- End 2010: 13,065 MW (+19.6 %)
- End 2011: 15,880 MW (+21.6 %)
- End 2012: 18,421 MW (+16.1 %)


