Wind and solar energy are growing rapidly in the U.S. As these energy sources become a bigger part of the electricity mix, their growth raises new questions: How do solar and wind influence energy prices? And since power plants last for decades, what should policymakers and investors think about to ensure that investments in power infrastructure pay off in the future?
Our research team at the Lawrence Berkeley National Laboratory decided to look at what effect a higher share of wind and solar will have on these questions. In our latest study, we found that high shares of these energy resources lead to several profound changes in electric power systems.
In particular, our study shows how solar and wind tend to lower energy prices, but they add new complexity for operating the grid, which has big implications for regulators. For consumers, this research is a reminder that making the electricity grid cleaner with wind and solar is an evolving process that requires significant changes to how the power grid is currently run—but one that offers large opportunities, if we as a country can become more flexible when we use electricity.
Long-term decisions
Previous analyses, including our own, showed that solar and wind already impact wholesale electricity markets, leading to more fluctuations in energy prices.
Solar power production, of course, follows the sun, increasing in the morning, producing most at midday, and falling off in the evening. Wind energy output depends on weather, seasons and geography. Solar is fairly predictable, especially in dry climates, and wind power can be forecast days and hours in advance with some accuracy, but both can vary widely. For these reason, solar and wind are also called variable renewable energy (VRE) sources.
Our latest study looked at whether certain policy decisions that are made based on assumptions reflecting low VRE levels will still achieve their intended objective if wind and solar are used at a high level in the future.
For example, a program administrator at a utility is asked to choose the most cost-effective set of options for energy efficiency measures. With a high percentage of solar, the utility may want to reduce demand in the evening when solar output is falling, rather than midday when there is plentiful emission-free electricity. So the efficiency focus may shift from air conditioners, typically needed more during the heat of the day, to lighting.
Another question is how to deploy electric vehicle chargers: With lots of solar generation, it may be best to put chargers at stores or office buildings, to charge when solar power output is high at midday. But in a region with strong winds at night and many wind turbines, power may be cheapest and cleanest when electric vehicles are parked at the owner’s residence.
No fuel cost equals lower wholesale energy prices
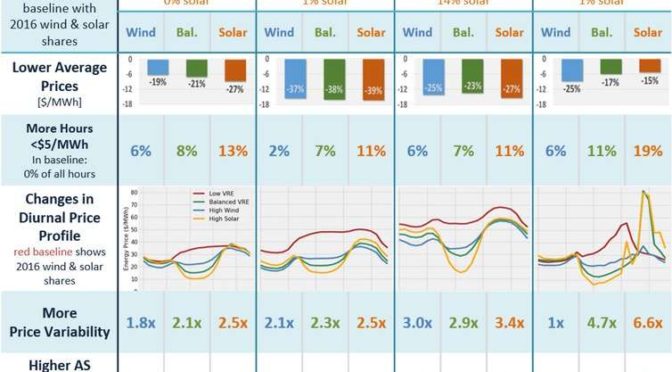
Our study looked at how prices change under two different scenarios: high and low VRE levels. We used detailed grid simulations to focus on the year 2030 for four electricity markets in the U.S.: CAISO in California, ERCOT in Texas, SPP in the Midwest and NYISO in New York. The analysis contrasts modeled market results for high wind and solar shares of 40-50 percent with a low renewable baseline reflecting 2016 levels.
For context, the Californian market had 14 percent solar and 7 percent wind energy in 2016 (state laws will require an increase to about 40 percent wind and solar in 2030). While Texas is the nation’s leader when it comes to the overall capacity of wind turbines generating 13 percent of all Texan energy, the regions in the Midwestern wind belt have the largest share of wind electricity – nearly 20 percent in 2016, but next to no solar. New York, meanwhile, has ambitious targets for 2030, but so far only very little wind (3 percent) and solar (1 percent).
The most fundamental changes of high levels of wind and solar relate to the timing of when electricity is cheap or expensive and the degree of regularity in those patterns.
In competitive wholesale markets, companies compete to supply power to the entities that operate regional electricity grids. Prices are determined by bidding, and set hourly based on supply and demand. All winning bidders are paid the market clearing price.
Since solar and wind have no fuel costs, they can bid low to make sure their power is accepted in the market. The more wind and solar in a market, the more often the clearing price falls. In today’s markets, we already see sometimes prices go to zero or even negative.
Large amounts of solar change the daily price patterns significantly. With high solar shares in Texas, for example, wholesale prices would slump in the middle of the day to an average of $10/MWh and then rise in the evening to an average of $80/MWh. For reference, a megawatt-hour (MWh) is a little more than the amount of electricity that the average American household consumes in a single month.

In a scenario with a high percentage of wind and solar contributing energy to the grid, the frequency of periods with low prices (below $5/MWh) increases to between 3 percent and 19 percent of hours depending on the region and mix of renewables. High solar in Texas, with its limited electric connections to neighboring regions, experiences the highest frequency of periods with near-zero prices.
Average hourly wholesale prices decrease with more VRE penetration, by $5-$16/MWh depending on the region and mix of wind and solar. Decreases in average wholesale prices and common occurrences of periods with very low prices will affect the profitability of VRE and inflexible generators such as nuclear and coal plants that operate in these hours.
Greater need for on-demand power
Price volatility increases with higher VRE shares, particularly in the high wind scenarios. Morning prices in the spring in CAISO can vary between $0 and $50/MWh with much wind, but fall in a much narrower range in the low VRE scenario.
Lastly, we found that peak hours are shifted from midday to the evening, after solar output declines. These new “net peaks” are shorter in duration yet are distributed over more days of the year. While peaks are typically met by ramping up conventional power plants, the shorter duration of net peaks creates opportunities for targeted energy efficiency, reducing the demand for electricity (demand response), changes in retail rates to reflect new peak times, or even batteries.
This study only highlights the possible impact of these altered price patterns on demand- and supply-side electric sector decisions. But it provides a foundation for later planned quantitative evaluations of these decisions in low and high VRE futures.


