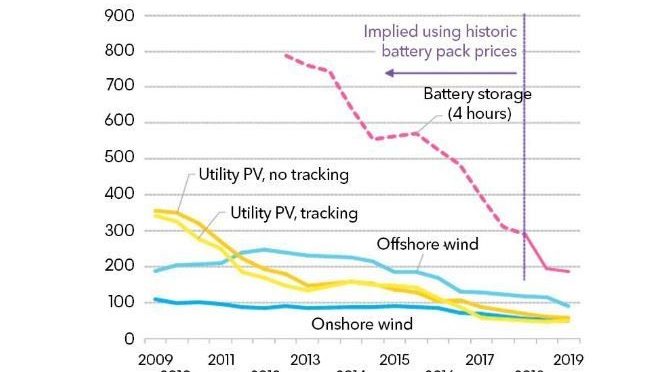
In many parts of the world, renewables represent the least cost source of new power generation technology. The global weighted average levelised cost of electricity (LCOE) from all commercially available renewable power generation technologies declined in 2018, including concentrated solar thermal power (CSP) (down 26% from 2017), bioelectricity (down 14%), solar PV and onshore wind energy (both down 13%), hydropower (down 11%), and geothermal and offshore wind power (both down 1%).

The decline is due in part to technology improvements and to reductions in installed costs, but also to
increasing
market competition. For example, major suppliers of wind turbines and
associated technology for hydropower plants noted strong and increasing
competition in the global marketplace, contracting sales, and declining
or even negative margins.
Because the LCOE of different technologies
can vary greatly by country and region, the global weighted average LCOE
is an imperfect measure; however, trends in this metric give a sense of
overall movement.
In 2018, the global weighted average LCOEs for hydropower (USD 47/MWh), onshore wind energy (USD 56/MWh) and bioelectricity (USD 62/MWh) were all at the lower end of the LCOE range for fossil fuel generation technologies (at USD 49/MWh to USD 174/MWh). These renewable technologies were able to compete head-to-head with fossilfuels, while geothermal projects (at USD 72/MWh) were not far behind.
As LCOE reductions have continued, solar PV has started
to compete directly with fossil fuels. Offshore wind power and
Concentrating Solar Thermal Power are less widely deployed, although
their costs also continue to fall. Offshore wind farm has become
competitive with fossil fuel generation technologies as well as some
Concentrated Solar Power projects.
Onshore wind energy now represents
a competitive source of electricity in most parts of the world. Between
2010 and 2018, the global weighted average LCOE of onshore wind power
fell 35%. In 2018 alone, it fell 13% compared to 2017, as total
installed costs declined and as improvements in wind energy technology
(for example, higher hub heights, larger swept areas, increased rotor
diameters and increased wind turbine size) helped increase the average
capacity factor of new wind
farm projects.
Wind turbine prices
fell by between 10% and 20% from 2017, depending on their size and
market, helping to reduce installed costs for wind farm projects around
the world.
A significant number of onshore wind power projects were
commissioned in 2018 with an LCOE of between USD 30/MWh and USD 40/MWh,
much lower than the cost of new fossil fuel power plants and even
rivalling the variable costs of fossil fuels in some regions.
The
global weighted average LCOE of offshore wind power declined 20%
between 2010 and 2018, from USD 159/MWh to USD 127/MWh, and declined 1%
in 2018 from the 2017 value. These reductions have been influenced by
improvements in wind turbines technology that drive higher wind
capacity
factors and reduce operations and maintenance costs, even as projects
were increasingly developed in deeper waters and farther from ports.
Solar
photovoltaic has experienced the most rapid cost declines, as module
prices have fallen more than 90% since 2010. In 2018, crystalline
silicon module prices fell by between 26% and 32% from 2017 levels due
to competition, continued improvements in module efficiency, as well as
manufacturing improvements that have reduced process costs and raw
materials needs.
As a result, the global weighted average LCOE of
utility-scale solar PV projects commissioned in 2018 fell to USD
85/MWh, 13% lower than in 2017. A number of utility-scale solar PV
projects commissioned in 2018 had an LCOE between USD 40/MWh and USD
50/MWh, but most (between the 5th and 95th percentiles) projects spanned
USD 58/MWh to USD 219/MWh.
With the least total installed capacity
of the renewable technologies, the weighted average LCOE for new CSP
projects commissioned in 2018 was USD 185/MWh. This represents a 26%
decline from 2017 and a 46% reduction from 2010. Recent reductions have
been driven by China’s involvement as a key player in supply chain and
solar thermal project development.

