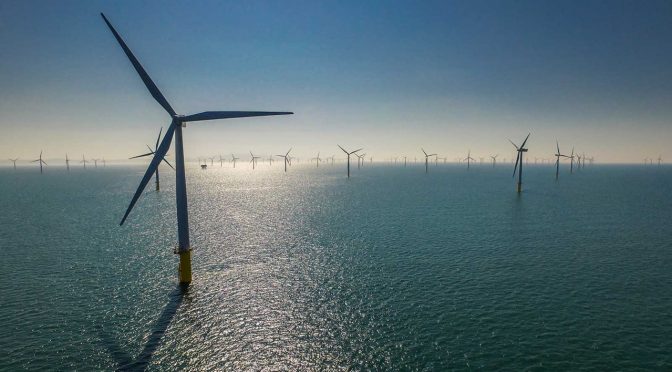
Global installed offshore wind capacity reached 27,064 MW in 2019 — a 19% increase from the previous year. This and other trends can be found in the 2019 Offshore Wind Technology Data Update, released by NREL on behalf of the U.S. Department of Energy’s Wind Energy Technologies Office.
Only one commercial offshore wind farm currently operates in the United States, but NREL’s 2019 data show advancing technology, falling prices, and increased federal and state support for the U.S. offshore wind industry. The U.S. offshore wind project pipeline grew 10% by the end of 2019, while the amount of U.S. offshore wind capacity under federal and state permitting with a signed offtake agreement was 6,439 MW — a threefold increase from the previous year.
Breakdown of the U.S. Offshore Pipeline

The U.S. offshore wind project pipeline grew more than 10% between 2018 and 2019. Graphics by NREL
The U.S. offshore wind project pipeline grew more than 10% between 2018 and 2019. Graphics by NREL
State investment has been a major driver of offshore wind’s growth in the United States. State procurement commitments climbed nearly 10,000 MW between 2018 and 2019, exceeding the capacity potential of the current U.S. pipeline.
“It’s stunning how fast state commitments have grown,” said NREL Offshore Wind Lead Walt Musial. “These numbers show that the industry is progressing toward real projects that are likely to get built.”
Wind Projects Proposed for Deeper Waters, Farther from Shore
Technological advancements helped offshore wind projects operate farther from shore in 2019. The average distance from shore was 47 kilometers (km) for installed projects, and project announcements indicate an increase to 70 km by 2025.
Projects are also being sited in deeper waters, with the capacity-weighted average depth of installed projects at 31 meters. Project announcements indicate that, over the next 5 years, offshore sites will increase to average depths to 43 meters for projects commencing operation in 2025.

“As the industry matures, projects are getting bigger, and they’re being sited farther from shore,” Musial said. “That means offshore wind projects become less visible from shore, which could make them more easily accepted by the communities they power.”
Semisubmersible offshore wind platforms accounted for 89% of substructures in floating wind projects either installed or announced in 2019. Other projects may use spar or tension-leg platform substructures.
Semisubmersible offshore wind platforms accounted for 89% of substructures in floating wind projects either installed or announced in 2019. Other projects may use spar or tension-leg platform substructures. Graphic by Josh Bauer, NREL
NREL’s research found that floating offshore wind — important for tapping deep-water offshore wind resources — has progressed as well, both in the United States and globally. In 2019, Maine’s public utility commission approved an updated power purchase agreement (PPA) for the 12-MW Aqua Ventus floating demonstration project, which will help the state develop its predominantly deep-water offshore wind resource and could usher in U.S. commercial floating wind development.
Globally, up to 1,549 MW of floating offshore wind has reached the permitting stage, while the total global pipeline reached 7,663 MW at the end of 2019.
Falling Costs Drive Offshore Development
Industry analyst projections indicate that offshore wind costs will continue to decline globally over the next decade. Costs are anticipated to reach a levelized cost of energy (LCOE) range of $50 to $75 per megawatt-hour (MWh) for fixed-bottom systems by 2030. In the United States, PPAs and offshore renewable energy certificate prices have fallen 40% over the last 2 years, making offshore wind projects more competitive in these electricity markets.
The information in the “2019 Offshore Wind Technology Data Update” is intended to provide offshore wind policymakers, regulators, developers, researchers, engineers, financiers, supply chain participants, and other stakeholders with up-to-date quantitative information about the offshore wind market, technology, and cost trends in the United States and worldwide.
For more information, view slides that display and summarize the “2019 Offshore Wind Technology Data Update PDF or download a spreadsheet of the dataMicrosoft Excel.

