
Future changes in solar radiation and rising temperatures will likely reduce global solar photovoltaic potential, but advancing photovoltaic technologies could counteract these effects. We investigate the potential of photovoltaic to satisfy energy demands given climate change and technological development. We find that conventional photovoltaic will require 0.5 to 1.2% of global land area to meet projected energy demands by 2085 without accounting for climate change effects. When considering climate impacts, this requirement increases to 0.7–1.5% of the global land area. However, utilising advanced photovoltaic technologies can reduce this area to 0.3–1.2%, effectively mitigating climate impacts. Regional climate change impacts vary substantially, resulting in photovoltaic potential decreases of up to 3% in Latin America and the Caribbean, and by up to 8% in South Asia. Our results suggest that technology-driven increases in future global photovoltaic energy production can more than compensate for the climate related reductions.
The potential land requirements and related land use change emissions of solar energy
ArticleOpen access03 February 2021
Small reduction in land surface albedo due to solar panel expansion worldwide
ArticleOpen access30 August 2024
Climate change extremes and photovoltaic power output
Article16 November 2020
Introduction
Solar photovoltaic (PV) is an increasingly important source of clean energy and is currently the third-largest renewable energy source after hydropower and wind, accounting for 3.6% of global energy production1,2. PV energy production grew by 22% (179 TWh) in the year 2020–2021, and a 25% average annual growth rate between 2022 and 2030 would be consistent with net-zero scenarios1 by 2050. Past projections have consistently underestimated the rate of PV deployment3, and the required acceleration in future growth may well be feasible.
A key factor to consider, however, is how much land area would be required to satisfy the global energy demand under different socio-economic and climate change futures4– and the extent to which improvements in PV technology will increase PV output. This is important because future changes in solar radiation and increasing temperatures arising from climate change will likely reduce global PV potential4. The PV capacity installed today is likely to remain in place for the next 20–30 years, but the rate at which the development and deployment of more efficient PV technologies that would offset climate change impacts is uncertain.
Previous research on climate change impacts using projections from general circulation models (GCMs) indicates varying effects on different types of PV systems; for example, a decline in global PV potential of up to 0.4% for large-scale PV, but an increase in rooftop PV potential of 2% by 21005. However, localized changes in the PV potential of existing PV installations6,7 under climate change scenarios range from ?19% to +16%4. Studies using regional climate models (RCMs) have projected PV potential declines of up to 20% in South Asia and Latin America8 and 34% in Sweden9. However, counteracting improvements in technology have not been consistently explored across regions, PV technologies, or climate change scenarios10,11.
Previous analyses have argued that the scope for large-scale PV deployment is limited because of competition with other land uses12,13. Some land uses, however, are multifunctional, such as agri-voltaic systems14. Pastures are generally well-suited to agri-voltaic systems in which solar panels are placed above grazing livestock. Such systems produce both electricity and food, and potentially benefit from shading for grazing animals and grass15. Other land uses with the potential for multifunctional PV deployment include highways, car parks and irrigation canals with PV panel shading16, and urban roof-tops17. In combination with technology improvements, these could substantially reduce land requirements for PV energy.
A few studies4,5 analysed climate change impacts on global PV potential for specific scenarios of climate change and advances in PV technology but without consideration of how the two could affect the global land requirement for PV installations. In this study, we analyse the global PV land area requirements to meet future energy demands, and how this land area changes under different climate futures and for more efficient PV technologies.
To explore the implications for future global PV potential, we pose the following research questions;
- 1. How much land area would be required for PV deployment to meet future energy demands under conventional and advanced PV technologies?
- 2. How do these land areas vary when the direct impacts of climate change on PV energy generation are accounted for?
- 3. How do PV potential and land area requirements vary when PV is combined with other land uses?
We address these questions using climate change scenarios for four Representative Concentration Pathways (RCPs; RCP2.6, RCP4.5, RCP6.0 and RCP8.5) from four General Circulation Models (GCMs), considering six different PV technologies, as described in the Methods section. We also use projections of future global energy demands for the shared socio-economic pathways (SSPs; SSP1, SSP2, SSP3, SSP4 and SSP5)18,19.
Results
How much land area would be required for PV deployment to meet future energy demands under conventional and advanced PV technologies?
The land area required for PV to satisfy potential global energy demand depends strongly, among other factors, on the technology used. Conventional Si PV module technology would require around 0.5–1.2% of the global land area to fulfil the projected energy demand for different SSP scenarios19, if placed to maximise energy generation (Fig. 1). Different world regions would require varying proportions of land to meet the energy demands for different SSP scenarios (Fig. 1), with East Asia and the Pacific, and Middle East and North Africa, requiring the most land area (see Table 1). However, if the conventional Si technology is replaced by more efficient PV technologies such as perovskites and III-V cells multijunctions (more details in Supplementary Table. 1), much less land would be needed to meet global energy demands (Table 1); just 0.3–1.0 % of the land area (between about one half and three-quarters of the area required for Si PV modules) (Fig. 1). Similar to the conventional Si case, these requirements vary regionally (Table 1) across the SSP scenarios (Fig. 1). They also vary according to treatment of site-specific variables such as the ground coverage ratio (GCR); with a standard value for this applied (more details in the Methods section), the land requirement would be: conventional Si (1.0–2.4%), perovskites (0.8–1.8%), and III-V cells multijunctions (0.5–1.1%) (Supplementary Fig. 1). This makes the total PV land area requirement needed to meet future energy demands equivalent to the current global urban area20,21.
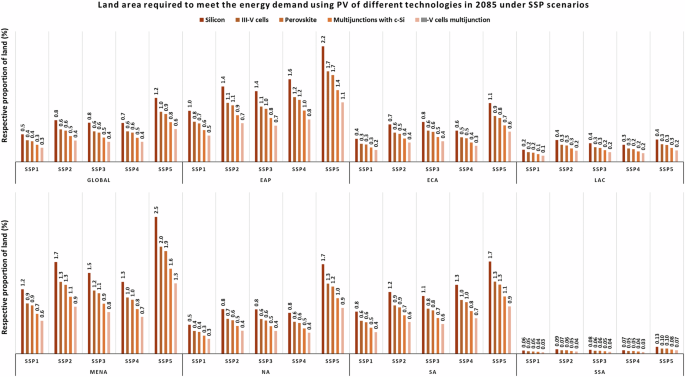
Table 1 Land areas (as percentage of global total land) required to meet energy demand using PV under different scenarios, and the change in PV potential due to climate change
How do land areas vary when the direct impacts of climate change on PV energy generation are accounted for?
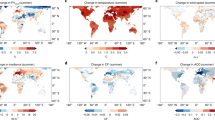
The projected slight increase in global mean annual incident solar radiation (?+?0.8% to +1.2% in 2050, and +0.4% to +1.0% in 2085) and the anticipated rise in mean temperature (?+?1.5?°C to +2.7?°C in 2050, and +1.5?°C to +5.0?°C in 2085) relative to the baseline (1991–2005) led to modelled declines in PV potential (?3.7 to ?4.5% in 2050 (2031–2070), and ?3.4 to ?5.0% in 2085 (2071–2100)) across the climate scenarios (Fig. 2). This is mainly because higher temperatures reduce PV panel efficiency by between 0.4 and 0.5% for every 1?°C increase above a panel temperature of 25?C22 (Fig. 3). Our univariate sensitivity analysis of climate variables (solar radiation and temperature) provides further insights to explain these differences. The analysis showed that when the temperature was kept constant but the radiation varied, there was an increase in PV potential. However, when considering the effect of temperature alone, PV potential decreased (see Supplementary Fig. 2). Different temperature trajectories among scenarios and regions contribute strongly to the varying regional impacts that we find (see Table 1, Fig. 2).
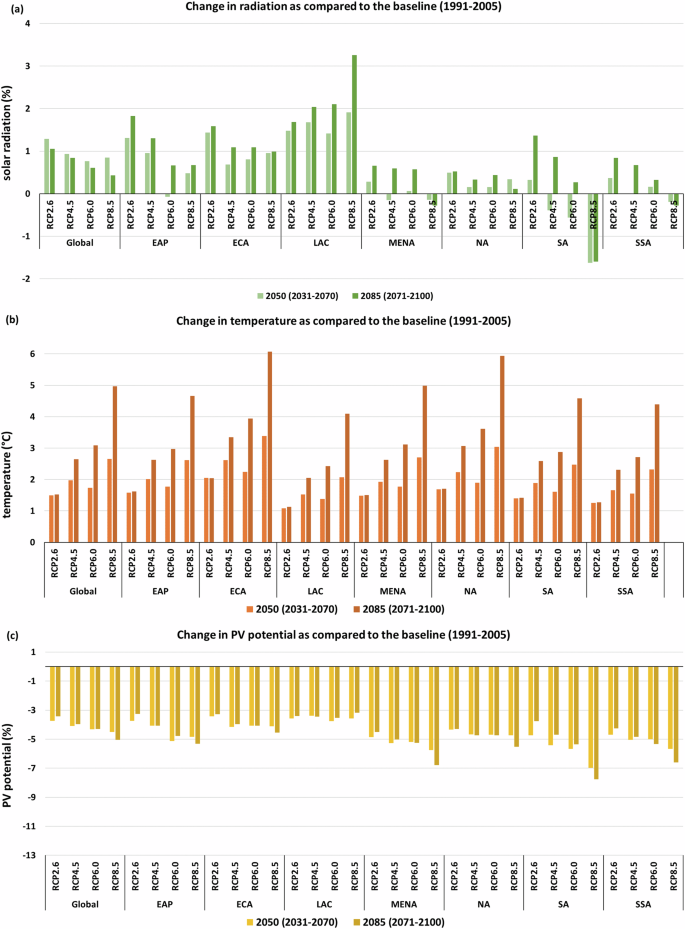
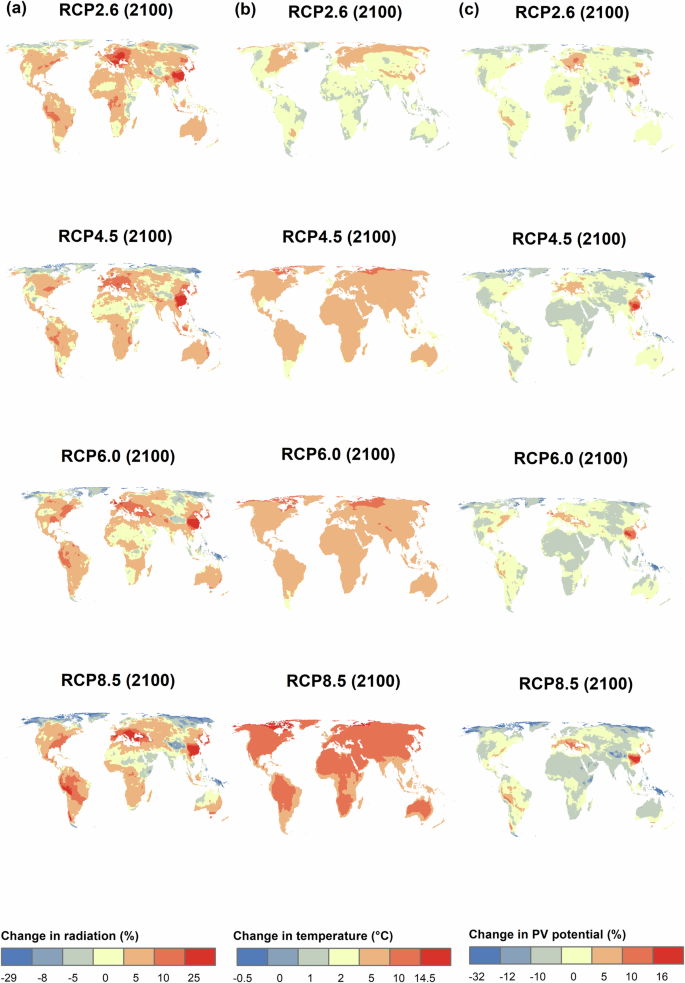
We therefore present a detailed global and regional assessment of climate change impacts on PV potential (Fig. 2, Supplementary Note 2) and land area requirements (discussed below). The climate change impacts show strong regional differences, with PV potential decrease of up to ?3% in Latin America and the Caribbean, and by up to ?8% in South Asia. These changes are more moderate compared with previous studies4, which analysed climate change impacts on existing PV sites globally and found a decline of up to 19% and an increase of up to 16% in the most affected sites.
The global mean PV potential varies between 359 and 1495?kWh/kWp (kilowatt hours per installed kilowatt-peak of the system capacity) depending on the losses23 considered in the estimation of PV potential4 across the climate scenarios (Supplementary Fig. 3). Using typical values for losses, ranges are much more restricted, with a global potential of 1340–1363 kWh/kWp. The largest regional value is in Sub-Saharan Africa (1621–1661 kWh/kWp), and the smallest is in Europe and Central Asia (976–989 kWh/kWp) (Supplementary Fig. 3, Supplementary Table. 1)4.
The combined effects of solar radiation and temperature changes produced declining trends in PV potential which explain the decline in global PV potential over the 21st century across climate scenarios (Supplementary Fig. 2)24,25. Speed of roll-out of new technologies, reducing costs26, and policy support for solar panels would enable PV to overcome these impacts, however27, suggesting that future PV energy production is resilient to climate change. However, technological development could enable PV deployment to overcome the negative impacts of climate change, as discussed below.
Climate neutrality requires a fast energy transition from conventional fossil fuels to renewable energy sources28,29, and solar PV power has immense potential to contribute to this transition, especially if emerging technologies fulfil their promise. However, the generation of solar PV energy will be impacted by climate change (discussed above), leading to a decline in the contribution of solar PV to future energy demands. As a consequence, to achieve a similar level of energy production, the land area under PV would need to be increased by, for example, 1.5% (or 3% when GCR is considered, Supplementary Fig. 5) of the global land area using conventional Si in a high- emission scenario (i.e., SSP5-RCP8.5; Fig. 4 & Supplementary Fig. 4). However, technology can offset the negative impacts of climate change as shown in Fig. 4. For example, only 0.7% (or 1.4% when GCR is considered Supplementary Fig. 6) of the global land area would be needed to meet the energy demand in the same scenario using III-V Multijunctions PV technology (Fig. 4). The benefits of technology in compensating for negative climate change effects will, however, depend on the rate of roll-out of new technology30. Meeting global energy demand from PV in 2085 (2071–2100) under the SSP-RCP scenarios would require 0.7–1.5% (conventional Si) of the global land area (Fig. 4), which is around 0.2–0.3 percentage points more than in the absence of climate change (Fig. 1).
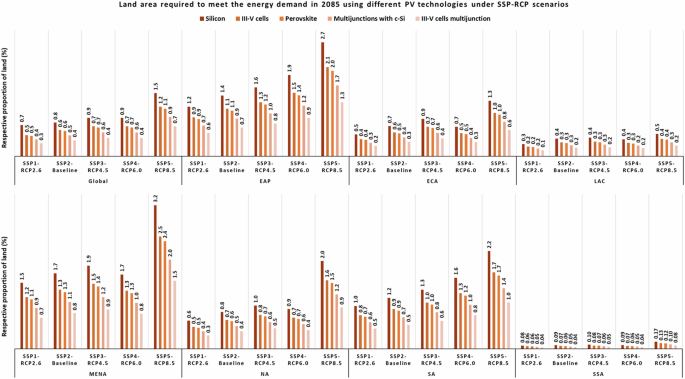
The sub-global land requirements would also increase (Table 1), for example by up to 0.2–0.5 percentage points in South Asia and East Asia and Pacific, 0.3–0.7 percentage points in the Middle East and North Africa, or just 0.02–0.04 percentage points in Sub-Saharan Africa (Fig. 4, Table 1). The large scope for PV production in Sub-Saharan Africa (with 14.7% of the current global population according to Our World in Data31) could play a crucial role in economic development and social well-being within the region. It could not only meet societal energy demands (potentially generating 6 to 26 times the regional energy demand, depending on the PV technology used and on assumed 0.5–1.0% of the global land area) (Supplementary Table. 2) but also provide new job opportunities through the PV sector. Likewise, the Middle East and North Africa (with 7.2% of the current global population) could generate 0.3 to 1.3 times their regional energy demand by 2050. This presents an alternative energy source even in the most fossil-fuel-dependent scenario, though it would require more land (Supplementary Table. 2). These regions include countries with a large potential for economic development that would need to be supported by sufficient energy. Likewise, the most populated regions of the world (East Asia together with Europe) have 31% of the current global population and could also meet their future energy demands from PV, since the PV potential in these regions will not change substantially in the future. The second most populated region, South Asia (25% of the current global population) will likely experience some local declines in PV potential under different climate scenarios, but will still retain huge potential (0.3 to 1.3 times the regional demand under high fossil fuel scenarios) for PV at larger scales32.
How does PV potential vary when combined with other land uses?
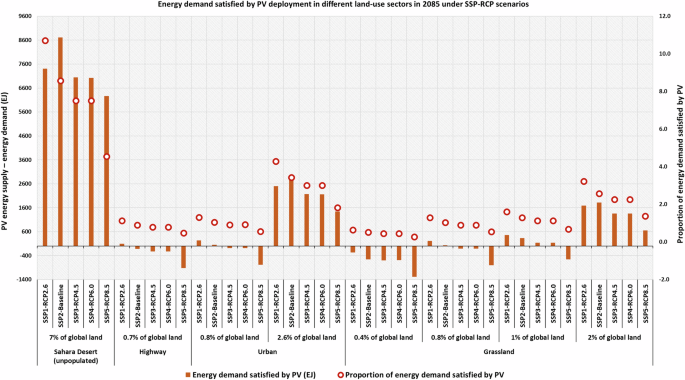
The global land area is limited and there is competition for land between multiple uses (including food, fibre and timber production). Identifying where PV could be deployed that would least affect other land-use is, therefore, critical. As an (hypothetical) example, the unpopulated area of the Sahara Desert is around 9 million k m2 (around 7% of the global land area). If this area were to be used for conventional Si PV deployment, around 5–11 times the global energy demand in 2085 across the SSP-RCP scenarios could be produced (Fig. 5). An alternative, arguably more realistic perspective is to consider the energy production arising from deploying PV on the 0.7% of global land area covered by highways as a shaded infrastructure, which could generate around 1.2 times more energy than demanded in 2085 under SSP1-RCP2.6 (though slightly less than demanded in other SSP-RCP scenarios). Moreover, replacing conventional urban infrastructure with PV-based infrastructure could be a substantial step toward energy sector transformation. Projections suggest that urban areas could range from about 1.1 million to 3.6 million k m2 across the SSP scenarios (around 0.8%–2.6% of the global land area)21 by 2100. Considering the high energy demands in urban areas, utilising building facades, rooftops, footpaths, parking lots and other urban infrastructure for PV deployment could provide 1.4 to 4.2 times the energy demanded in 2085 across scenarios (Fig. 5). Alternatively, pastures could be used for large scale PV deployment as a multifunctional land-use. Depending on how grasslands are defined, they account for between 20% and 40% of the global land area33, with 2% of these (i.e., 0.4–0.8% of the global land area) being intensive pasture33. If parts of these areas were used for PV energy production, they could generate 0.3–1.3 times the global energy demand while still retaining potential for livestock production (Fig. 5), depending on location, and with small additional negative impacts on biodiversity.
Deploying solar panels in deserts and grasslands has implications for other environmental, ecosystem services and biodiversity sectors and so would need careful reflection. For example, PV in the Sahara could, in principle, prompt increased regional vegetation and rainfall34, while producing enough electricity to satisfy global energy demands along with increased regional vegetation and rainfall. These local benefits could however be offset by atmospheric teleconnections leading to rises in surface temperature, forest degradation, droughts in the Amazon and sea-ice loss34. Grasslands globally are threatened by conversion to agriculture and forestry, and industrial PV deployment could have similar negative effects35,36. Conversely, some recent evidence suggests that solar panels can improve grassland biodiversity by retaining soil moisture and creating microhabitats14,37,38,39.
The future energy demand is highly uncertain and depends on both socio-economic projections and economic modelling methods. In contrast with the integrated assessment model (IAM) projections of total energy demand used here, which were calculated from fundamental socio-economic drivers such as population development, economic growth, technological change and lifestyles19, the PV capacity of 75 TW40 (roughly equivalent to 2365 EJ) in 2050 considering climate, cost, and development goals (Supplementary Fig. 7) was projected. This is about twice the demand calculated by IAM19. When converting the 75 TW installed capacity into PV energy demand, we assumed the highest possible energy generation, which is, however, subject to on-site PV system characteristics and local climatic impacts including storms, floods, heatwaves, and so on. To satisfy this demand, PV deployment would be required on about 1% of the global land area, producing 1181–2690 EJ across the SSP-RCP scenarios and technologies (Supplementary Fig. 7 & Supplementary Table. 1) (less than 1% of the cropland area would meet the current electricity demand if transformed to agri-voltaics13). Increasing future demand for renewable energy could in principle, therefore, be met by global PV deployment5 on an area of land that is about the same as the current global urban area20,21.
Discussion
We find strong regional impacts of climate change on PV potential, largely attributable to temperature change, but which are lower in magnitude than the positive impact of new PV technologies. Our estimates slightly differ from the previous study5 which estimated a decline in the large-scale PV of up to 0.4%. The use of different climate projections is one reason for this difference, as is the inclusion of different modelling assumptions and PV technologies. Our study considered the modelled historic climate of 1991–2005 from the ISIMIP2b dataset41 in contrast with the former study5 which used the SSP2-RCP6.0 modelled data with and without climate impacts for 1971–2001 as the baseline. The historic period of 1991–2005 corresponds to a ‘recent climate’ baseline relevant to existing PV installations, which would have been installed over the last one to three decades.
Large-scale PV deployment is likely to be affected by several additional factors. Challenges include those associated with the increased demand for energy storage and grid stabilisation to deal with intermittency due to seasonal cycles42,43. Lithium-ion battery-based methods are ideal for short-duration storage (a few hours)43, whereas thermal, hydrogen and pumped hydro storage methods44,45 can store energy for up to several days. Floating PV systems that are installed on the surface of water bodies instead of on land have been discussed as an alternative to large-scale, ground-mounted solar panels, with the additional benefit of increased PV energy production due to the cooling effect provided by water bodies46. Floating PV also helps to reduce evaporation, especially in arid regions. However, there are concerns about the environmental impacts of these systems, such as the risk of chemical pollution during PV installation and threats to water mixing, ecology and biodiversity47.
Booming global demand for PV deployment may instigate a shortage of PV raw materials in some countries or may encourage new PV markets48. Technological development is driven by economic growth, which varies between regions, allowing a rough estimation of the differential rates of PV uptake across the world. According to gross domestic product based on purchasing power parity (GDP(PPP)) projections, different world regions, especially South Asia, Middle East and North Africa, and Sub-Saharan Africa show huge GDP(PPP) per capita growth in 2085 across the SSP scenarios49,50 which may help boost the energy transition and combat the adverse impacts of climate change. However, these regions will face higher challenges in energy transitioning under SSP3 and SSP4 scenarios due to low GDP(PPP) per capita. The overall scope for PV to satisfy energy demand, possibly while producing co-benefits via agri-voltaics and/or multifunctional PV land uses, therefore remains highly context-dependent.
Even given technological development, the adoption rate of emerging PV technologies may be contingent upon factors such as GDP, educational attainment, and wider technological advancements within individual countries, necessitating further investigation. Furthermore, PV technologies demonstrate spatial dependencies with regard to temperature, underscoring the importance of meticulous technology selection, accounting for associated factors, as a valuable enhancement to PV infrastructure deployment and further research. Exploring recent climate models with bias-adjusted datasets is one important element of better understanding patterns of temperature effects.
Conclusion
Large-scale deployment of photovoltaic (PV) systems is essential to meet increasing global energy demands and to limit emissions contributing to climate change. However, such deployment must account for future climate impacts on PV potential as well as competition for land itself. Some of these issues could be reduced by PV deployment coupled with multifunctional land use, such as agrivoltaics, though further investigation of these is needed. In any case, new technologies are likely to be more efficient, producing more energy while using less land compared to conventional technologies. By integrating new PV technologies and carefully planning their implementation, it appears possible to create a sustainable energy future that addresses both environmental and energy needs.
Methods
Here, we use the four Representative Concentration Pathways, including low-, mid-, and high-emission scenarios derived from four General Circulation Models, and combine them with future global energy demands data to investigate the potential of different photovoltaic technologies in mitigating climate impacts. We assessed the potential land area required to satisfy global energy demand under future Shared Socio-economic Pathways (SSP)50 and more efficient PV technologies (more details in Supplementary Table. 1). We explored the sensitivity of global and regional PV potential to climatic variables, technology, and competition for land. We then determined how much more land would be needed when climate change comes into play in different Representative Concentration Pathways (RCP)51, and to what extent technology could offset the negative impacts of climate change. As the land is limited by the need to provide other ecosystem services, we also explored the potential land alternatives for PV deployment. This included a range of global land fractions that might be used for PV deployment by 2050, for which we computed the total PV energy production for different combinations of PV technology and PV land-use fractions. We compared this potential energy production to future energy demands under SSP-RCP scenarios from different sources.
Data used
We used data from the Coupled Model Intercomparison Project (CMIP) version 5, noting that many of the CMIP6 models exhibit higher climate sensitivity52,53 and estimate more rapid rates of temperature rise, potentially influencing estimates of PV potential. The CMIP5 and CMIP6 projections are broadly similar regarding irradiation54. The temperature biases could be scaled55 but would then lead to uncertainty and complexity in our PV estimation, while not altering results greatly.
We selected an averaging period of 1991–2005 to calculate the recent climate from ISIMIP2b as the baseline, as this timeframe aligns with the definition of ‘climate’ recommended by the World Meteorological Organisation (WMO)56. This time-period allows exploration of future changes in PV potential compared to the baseline (and implicitly also to existing PV installations, which would have been installed over the last 1–2 decades).
The solar radiation and temperature data were taken from four GCMs: the Hadley Centre Global Environment Model version 2-Earth System (HadGEM2-ES), Model for Interdisciplinary Research on Climate Version Five (MIROC5), Geophysical Fluid Dynamics Laboratory Earth System Model version 2?M (GFDL-ESM2M) and Institut Pierre Simon Laplace Climate Model Version 5- Low Resolution (IPSL-CM5A-LR), which are frequently used in global studies5. Data were bias-adjusted in the Inter-Sectoral Impact Model Intercomparison Project (ISIMIP2b41) which provides cross-sectoral modelling outcomes consistent with different climate change scenarios (RCP2.6, RCP4.5, RCP6.0 and RCP8.5) that were used to analyse the variations in PV potential.
Global gridded estimates of PV potential across the scenarios4,57 were used for the climate change analysis at global and regional scales. IAM projections of global and regional demands for the Shared Socio-economic Pathways (SSPs) (SSP1, SSP2, SSP3, SSP4, SSP5) from the IIASA database19,50 were processed and compared with the solar PV energy generation in 2050 (2031–2070) and 2085 (2071–2100) across the SSP-RCP scenarios. We also derived future energy demand calculations50 as an additional and more recent projection. The downscaled total energy projections19 were used to derive the demands at a regional scale in different scenarios.
PV energy generation
PV potential was estimated4 which considered climatic variables such as solar radiation and air temperature. The effect of these on PV module efficiency was calculated using common standard values for all technologies22. Wind speed is also important in solar PV energy systems for its cooling properties, which can increase energy generation, and for increasing or decreasing soiling on the PV panels55. However, the accuracy of wind speed data and projections in the lowest layer of the atmosphere depends on the spatial distribution and quality of measurements from meteorological observation networks4. Climate models only provide projections of regional patterns rather than local microclimate, and extremely low or high wind speed values will not be well represented58. Thus, including wind speed would greatly increase uncertainty without adding reliably to the results, so was not considered in the previous study4 or here. However, various other losses including soil or dust accumulation which partially depend on wind were considered in the method described above.
We covered a range of minimum and maximum achievable efficiencies tested for different conditions worldwide59 for different technologies (Supplementary Table. 1, Supplementary Note 1). These PV technologies have varying levels of efficiency59. Crystalline Si has been used conventionally to date, but more efficient technologies such as perovskites60 and III–V multijunctions61,62 have proven to be effective in some applications. We also used a single figure (i.e., mean efficiency) for individual technologies59 to give an estimate of the final PV land area for energy generation that provides a clear basis for interpreting the results and associated uncertainty.
For calculating the total energy generation, we used the PV energetic outputs (as discussed above), ground coverage ratio (GCR) of 0.51 as a standard value6, efficiencies of various PV module technologies and the global and regional land areas as described in Table 1.
The mean PV potential was calculated for the globe and different world regions. This was used to calculate the total PV energy generation corresponding to different PV technologies (Supplementary Table. 2, Supplementary Note 2), and the required land area (proportion of total global/regional land area). The land area was computed from the World Bank regions’ geographical boundaries for different regions. More details on land area and mean PV potential considered for different world regions can be found in Table 2.Table 2 Land area4 and mean PV potential (baseline 1991–2005) considered globally and in different world regions
Land area required for PV deployment to meet future energy demands under conventional and advanced PV technologies
The area of land needed to satisfy the energy demand19 globally/regionally under climate change (RCP) and shared-socio-economic change (SSP) scenarios was quantified in terms of the percentage of global/regional land. The required PV land area was computed by dividing the energy demand by the total PV energetic output on global/regional land for different technologies and under different SSP-RCP scenarios. We excluded permanent water bodies and ice cover. However, we did not consider other PV land suitability factors as this would require extensive further analysis. The PV land area varied greatly depending on the type of PV technology considered in the calculations.
Climate change impacts on PV potential and land area requirements
To understand the climate change impacts on PV potential, we first explored the variability in the PV potential due to solar radiation and temperature change through a sensitivity analysis. In doing so, we averaged over all four GCMs (discussed above) for individual climatic variables, year and RCP scenarios. However, to understand this variability, we account for both the influence of the individual GCM model as well as the combined influence in terms of the mean of all four GCMs in all four RCP scenarios. We then analysed climate change impacts on the global/regional PV potential from the baseline PV energetic outputs generated from the observational climate dataset and the PV outputs for future climate projections (discussed below). We also analysed the PV land requirement to satisfy energy demands under the influence of climate change, followed by an analysis of alternative land uses for deploying PVs as discussed below.
Sensitivity analysis of the climatology in generating the PV potential under different climate change scenarios
To understand the influence of individual climatic variables on PV potential under climate change projections, a univariate sensitivity analysis was performed. The sensitivity analysis included recording the decadal PV potential for the time series 2030–2100 in three different cases; first, varying solar radiation but keeping the temperature constant, second, varying the temperature but keeping the solar radiation constant, and third, variations in both variables. A routine was programmed in the PV potential modelling to undertake the sensitivity analysis.
Climate change impacts at global and regional scale
The PV potential was calculated against the mean climate data of the four models (GCM), and the impacts were analysed from the baseline (1991–2005) to 2050 (2031–2070) and 2085 (2071–2100) across the SSP-RCP scenarios at the global scale. We then investigated the climate change impacts on seven World Bank regions: South Asia, Sub-Saharan Africa, North America, Latin America and the Caribbean, Middle East and North Africa, East Asia and Pacific, and Europe and Central Asia.
Comparison of the generated PV energy with the total energy demand projections
To calculate the amount of solar PV energy, global gridded estimates were applied over different PV land-use fractions12 (0.5 to 3%) using different efficiency ranges of the PV module technologies (Supplementary Table. 1) to assess the potential effects of emerging PV technologies to offset climate impacts. The energy demand projections from the IAM dataset19,50 were translated into SSP-RCP scenarios; SSP1-RCP2.6, SSP2-baseline (1991–2005), SSP3-RCP4.5 and SSP4-RCP6.0 and SSP5-RCP8.518. The amount of solar PV energy generated in different PV settings was then compared with the projected energy demands19,39, globally. The regional demand projections were derived from gridded total energy projections19, which were then compared with the solar PV energy generated for different world regions in varying PV settings (PV land-use fractions and the module technology used).
Exploring PV deployment in different land-use sectors
To explore the possibility of PV deployment in different land-use sectors, we considered the Sahara Desert (around 7% of the global land area), Highways (0.7% of the global land), Urban land (0.8%–2.6% of the global land area) by 210018, and a proportion (2.0–5.0%) of the global Grassland area (about 20–40%, depending on how grasslands are defined) across different scenarios.
Data availability
We provide global gridded Photovoltaic (PV) potential dataset (https://osf.io/8uv2s/), and other input data sources such as climate data (https://www.isimip.org/outputdata/isimip-repository/), World regions boundaries (https://datacatalog.worldbank.org/) and IIASA SSP database (https://tntcat.iiasa.ac.at/SspDb) are publicly available. Any other data that support the findings of this study are included within the article, online methods and supplementary materials.
Code availability
The model code used is publicly available at https://osf.io/8uv2s/. All maps were generated using ArcGIS 10.7.1 and Microsoft Office Professional Plus 2019.
References
- IEA (2022), Solar PV, IEA, Paris https://www.iea.org/reports/solar-pv, License: CC BY 4.0.
- Cherp, A., Vinichenko, V., Tosun, J., Gordon, J. A. & Jewell, J. National growth dynamics of wind and solar power compared to the growth required for global climate targets. Nat. Energy 6, 742–754 (2021).Article Google Scholar
- Victoria, M. et al. Solar photovoltaics is ready to power a sustainable future. Joule 5, 1041–1056 (2021).Article CAS Google Scholar
- Saxena, A., Brown, C., Arneth, A. & Rounsevell, M. Modelling the global photovoltaic potential on land and its sensitivity to climate change. Environ. Res. Lett. 18, 104017 (2023).Article Google Scholar
- Gernaat, D. E. et al. Climate change impacts on renewable energy supply. Nat. Clim. Change 11, 119–125 (2021).Article Google Scholar
- Kruitwagen, L. et al. A global inventory of photovoltaic solar energy generating units. Nature 598, 604–610 (2021).Article CAS Google Scholar
- Dunnett, S., Sorichetta, A., Taylor, G. & Eigenbrod, F. Harmonised global datasets of wind and solar farm locations and power. Sci. data 7, 130 (2020).Article Google Scholar
- Yalew, S. G. et al. Impacts of climate change on energy systems in global and regional scenarios. Nat. Energy 5, 794–802 (2020).Article Google Scholar
- Perera, A. T. D., Nik, V. M., Chen, D., Scartezzini, J. L. & Hong, T. Quantifying the impacts of climate change and extreme climate events on energy systems. Nat. Energy 5, 150–159 (2020).Article Google Scholar
- Eker, S. Drivers of photovoltaic uncertainty. Nat. Clim. Change 11, 184–185 (2021).Article Google Scholar
- Jaxa-Rozen, M. & Trutnevyte, E. Sources of uncertainty in long-term global scenarios of solar photovoltaic technology. Nat. Clim. Change 11, 266–273 (2021).Article Google Scholar
- Van de Ven, D. J. et al. The potential land requirements and related land use change emissions of solar energy. Sci. Rep. 11, 1–12 (2021). Google Scholar
- Adeh, E. H., Good, S. P., Calaf, M. & Higgins, C. W. Solar PV power potential is greatest over croplands. Sci. Rep. 9, 1–6 (2019).Article CAS Google Scholar
- Barron-Gafford, G. A. et al. Agrivoltaics provide mutual benefits across the food–energy–water nexus in drylands. Nat. Sustain 2, 848–855 (2019).Article Google Scholar
- Andrew, A. C., 2020. Lamb growth and pasture production in agrivoltaic production system.
- Zhu, X. & Cui, Q., 2012. Delivering solar highway project: A case study. In Construction Research Congress 2012: Construction Challenges in a Flat World (pp. 31-40).
- Fakhraian, E., Forment, M. A., Dalmau, F. V., Nameni, A. & Guerrero, M. J. C. Determination of the urban rooftop photovoltaic potential: A state of the art. Energy Rep. 7, 176–185 (2021).Article Google Scholar
- O’Neill, B. C. et al. Achievements and needs for the climate change scenario framework. Nat. Clim. change 10, 1074–1084 (2020).Article Google Scholar
- Bauer, N. et al. Shared socio-economic pathways of the energy sector–quantifying the narratives. Glob. Environ. Change 42, 316–330 (2017).Article Google Scholar
- Arneth, A. et al. 2019: Framing and Context. In: Climate Change and Land: an IPCC special report on climate change, desertification, land degradation, sustainable land management, food security, and greenhouse gas fluxes in terrestrial ecosystems [P. R. Shukla, J. Skea, E. Calvo Buendia, V. Masson-Delmotte, H.-O. Pörtner, D. C. Roberts, P. Zhai, R. Slade, S. Connors, R. van Diemen, M. Ferrat, E. Haughey, S. Luz, S. Neogi, M. Pathak, J. Petzold, J. Portugal Pereira, P. Vyas, E. Huntley, K. Kissick, M. Belkacemi, J. Malley, (eds.)].
- Gao, J. & O’Neill, B. C. Mapping global urban land for the 21st century with data-driven simulations and Shared Socioeconomic Pathways. Nat. Commun. 11, 2302 (2020).Article CAS Google Scholar
- Kawajiri, K., Oozeki, T. & Genchi, Y. Effect of temperature on PV potential in the world. Environ. Sci. Technol. 45, 9030–9035 (2011).Article CAS Google Scholar
- Cordero, R. R. et al. Effects of soiling on photovoltaic (PV) modules in the Atacama Desert. Sci. Rep. 8, 1–14 (2018).Article CAS Google Scholar
- Jerez, S. et al. The impact of climate change on photovoltaic power generation in Europe. Nat. Commun. 6, 1–8 (2015).Article Google Scholar
- Yang, Q. et al. A GIS-based high spatial resolution assessment of large-scale PV generation potential in China. Appl. energy 247, 254–269 (2019).Article Google Scholar
- Schmidt, T. S., Born, R. & Schneider, M. Assessing the costs of photovoltaic and wind power in six developing countries. Nat. Clim. Change 2, 548–553 (2012).Article Google Scholar
- Creutzig, F. et al. The underestimated potential of solar energy to mitigate climate change. Nat. Energy 2, 1–9 (2017).Article Google Scholar
- Way, R., Ives, M. C., Mealy, P. & Farmer, J. D. Empirically grounded technology forecasts and the energy transition. Joule 6, 2057–2082 (2022).Article Google Scholar
- Nijsse, F. J. M. M. et al. The momentum of the solar energy transition. Nat. Commun. 14, 6542 (2023).Article CAS Google Scholar
- Nayak, P. K., Mahesh, S., Snaith, H. J. & Cahen, D. Photovoltaic solar cell technologies: analysing the state of the art. Nat. Rev. Mater. 4, 269–285 (2019).Article CAS Google Scholar
- Our World in Data, https://ourworldindata.org/.
- Groesbeck, J. G. & Pearce, J. M. Coal with carbon capture and sequestration is not as land use efficient as solar photovoltaic technology for climate neutral electricity production. Sci. Rep. 8, 1–17 (2018).Article CAS Google Scholar
- IPCC, 2019: Climate Change and Land: an IPCC special report on climate change, desertification, land degradation, sustainable land management, food security, and greenhouse gas fluxes in terrestrial ecosystems [P. R. Shukla et al. (eds.)] (2024).
- Lu, Z. et al. Impacts of large?scale Sahara solar farms on global climate and vegetation cover. Geophys. Res. Lett. 48, e2020GL090789 (2021).Article Google Scholar
- Scholtz, R. & Twidwell, D. The last continuous grasslands on Earth: Identification and conservation importance. Conserv. Sci. Pract. 4, e626 (2022).Article Google Scholar
- Carbutt, C., Henwood, W. D. & Gilfedder, L. A. Global plight of native temperate grasslands: going, going, gone? Biodivers. Conserv. 26, 2911–2932 (2017).Article Google Scholar
- Blaydes, H., Potts, S. G., Whyatt, J. D. & Armstrong, A. On?site floral resources and surrounding landscape characteristics impact pollinator biodiversity at solar parks. Ecol. Solut. Evid. 5, e12307 (2024).Article Google Scholar
- Zhang, B. et al. Deploying photovoltaic arrays in degraded grasslands is a promising win-win strategy for promoting grassland restoration and resolving land use conflicts. J. Environ. Manag. 349, 119495 (2024).Article CAS Google Scholar
- Nowak, A. et al. Ecovoltaics-a truly ecological and green source of renewable goods. Ecol. Chem. Eng. S 30, 315–332 (2023). Google Scholar
- Haegel, N. M. et al. Photovoltaics at multi-terawatt scale: waiting is not an option. Science 380, 39–42 (2023).Article CAS Google Scholar
- Lange, S. and Büchner, M., 2017. ISIMIP2b bias-adjusted atmospheric climate input data (v1. 0). ISIMIP Repository. Version 1.0.
- Yin, J., Molini, A. & Porporato, A. Impacts of solar intermittency on future photovoltaic reliability. Nat. Commun. 11, 1–9 (2020).Article Google Scholar
- Wu, C., Zhang, X. P. & Sterling, M. Solar power generation intermittency and aggregation. Sci. Rep. 12, 1–12 (2022). Google Scholar
- Armstrong et al. (2022). The Future of Energy Storage. MIT Press.
- Pandey, V., Sircar, A., Yadav, K. and Bist, N., 2023. Pumped hydro storage for intermittent renewable energy: Present status and future potential in India. MRS Energy & Sustainability, pp.1-18.
- Ilgen, K., Schindler, D., Wieland, S. & Lange, J. The impact of floating photovoltaic power plants on lake water temperature and stratification. Sci. Rep. 13, 7932 (2023).Article CAS Google Scholar
- Pouran, H. M., Lopes, M. P. C., Nogueira, T., Branco, D. A. C. and Sheng, Y., 2022. Environmental and technical impacts of floating photovoltaic plants as an emerging clean energy technology. Iscience, 25.
- Libra, M. et al. Reduced real lifetime of PV panels–Economic consequences. Sol. Energy 259, 229–234 (2023).Article Google Scholar
- Cuaresma, J. C. Income projections for climate change research: A framework based on human capital dynamics. Glob. Environ. Change 42, 226–236 (2017).Article Google Scholar
- Riahi, K. et al. The Shared Socioeconomic Pathways and their energy, land use, and greenhouse gas emissions implications: An overview. Glob. Environ. change 42, 153–168 (2017).Article Google Scholar
- van Vuuren, D. P. et al. The representative concentration pathways: an overview. Climatic Change 109, 5 (2011).Article Google Scholar
- Zelinka, M. D. et al. Causes of higher climate sensitivity in CMIP6 models. Geophys. Res. Lett. 47, e2019GL085782 (2020).Article Google Scholar
- Hausfather, Z., Marvel, K., Schmidt, G. A., Nielsen-Gammon, J. W. & Zelinka, M. Climate simulations: Recognize the ‘hot model’problem. Nature 605, 26–29 (2022).Article CAS Google Scholar
- Eyring, V. et al. 2021: Human Influence on the Climate System. In Climate Change 2021: The Physical Science Basis. Contribution of Working Group I to the Sixth Assessment Report of the Intergovernmental Panel on Climate Change [Masson-Delmotte, V., P. Zhai, A. Pirani, S. L. Connors, C. Péan, S. Berger, N. Caud, Y. Chen, L. Goldfarb, M. I. Gomis, M. Huang, K. Leitzell, E. Lonnoy, J. B. R. Matthews, T. K. Maycock, T. Waterfield, O. Yelekçi, R. Yu, and B. Zhou (eds.)]. Cambridge University Press, Cambridge, United Kingdom and New York, NY, USA, pp. 423–552, https://doi.org/10.1017/9781009157896.005
- Nijsse, F. J. M. M., Cox, P. M. & Williamson, M. S. Emergent constraints on transient climate response (TCR) and equilibrium climate sensitivity (ECS) from historical warming in CMIP5 and CMIP6 models. Earth Syst. Dynam. 11, 737–750 (2020).Article Google Scholar
- World Meteorological Organization, https://wmo.int/.
- Saxena, A., Brown, C., Arneth, A., & Rounsevell, M. (2023, November 14). Global Photovoltaic Potential Modelling (2020-2100). https://doi.org/10.17605/OSF.IO/8UV2S.
- Li, X., Mauzerall, D. L. & Bergin, M. H. Global reduction of solar power generation efficiency due to aerosols and panel soiling. Nat. Sustainability 3, 720–727 (2020).Article Google Scholar
- ESMAP. 2019. Global Solar Atlas 2.0 Technical Report. Washington, DC: World Bank.
- Green, M. et al. Solar cell efficiency tables (version 57). Prog. photovoltaics: Res. Appl. 29, 3–15 (2021).Article Google Scholar
- Kim, J. Y., Lee, J. W., Jung, H. S., Shin, H. & Park, N. G. High-efficiency perovskite solar cells. Chem. Rev. 120, 7867–7918 (2020).Article CAS Google Scholar
- Philipps, S. P., Dimroth, F. and Bett, A. W., 2018. High-efficiency III–V multijunction solar cells. In McEvoy’s handbook of photovoltaics (pp. 439-472). Academic Press.
Acknowledgements
We acknowledge the KIT Future Fields Programme and Helmholtz Association, Germany for supporting this work.
Funding
Open Access funding enabled and organized by Projekt DEAL.
Author information
Authors and Affiliations
- Institute of Meteorology and Climate Research, Atmospheric Environmental Research (IMK-IFU), Karlsruhe Institute of Technology, Garmisch-Partenkirchen, GermanyAnkita Saxena, Calum Brown, Almut Arneth & Mark Rounsevell
- Highlands Rewilding Limited, The Old School House, Bunloit, Drumnadrochit, UKCalum Brown
- Institute of Geography and Geo-ecology, Karlsruhe Institute of Technology, Karlsruhe, GermanyAlmut Arneth & Mark Rounsevell
- School of Geosciences, University of Edinburgh, Edinburgh, UKMark Rounsevell
Contributions
A.S.—conceptualisation, modelling, analysis, results interpretation and original draft preparation. C.B.—analysis, results interpretation, review and editing. A.A.—conceptualisation, results interpretation, review and editing. M.R.—conceptualisation, results interpretation, review and editing. All authors contributed to the revision of the manuscript.