China’s energy revolution, which underpins its transformation into the world’s largest manufacturing system (the new “workshop of the world”), continues to astonish all observers and to terrify some. China is known widely as the world’s largest user and producer of coal, and the world’s largest emitter of carbon dioxide and other greenhouse gases. This is true. Less noticed has been the fact that China is also building the world’s largest renewable energy system – which by 2013 stood at just over 1 trillion kilowatt hours – already nearly as large as the combined total of electrical energy produced by the power systems of France and Germany.1
The energy landscape continues to give the clearest indication of the trends in industrial dynamics and prospects for the future. China is powering ahead with renewables while at the same time it expands its reliance on fossil fuels; the US by contrast is further locking in its dependence on fossil fuels. The distinction is critical.
Data for the full-year 2013 are now available, from both the Federal Energy Regulatory Commission (FERC) in the US and the China Electricity Council (CEC) as well as the National Energy Administration (NEA) in China.2 This allows us to examine the total electric power systems in each country, and to assess the direction of change by studying the increments in power generation capacity added in 2013, as well as additional electrical energy generated and the allocation of new investments across the three main energy sources – fossil fuels (mainly coal); renewables, and nuclear.
Both the US and China now have electric power systems rated at just north of 1 trillion watts each – with China edging ahead at 1.25 TW compared with the US at 1.16 TW – a significant milestone in itself, as China emerges as the most electrically powered nation on the planet (while per capita power consumption remains four times higher for the US).
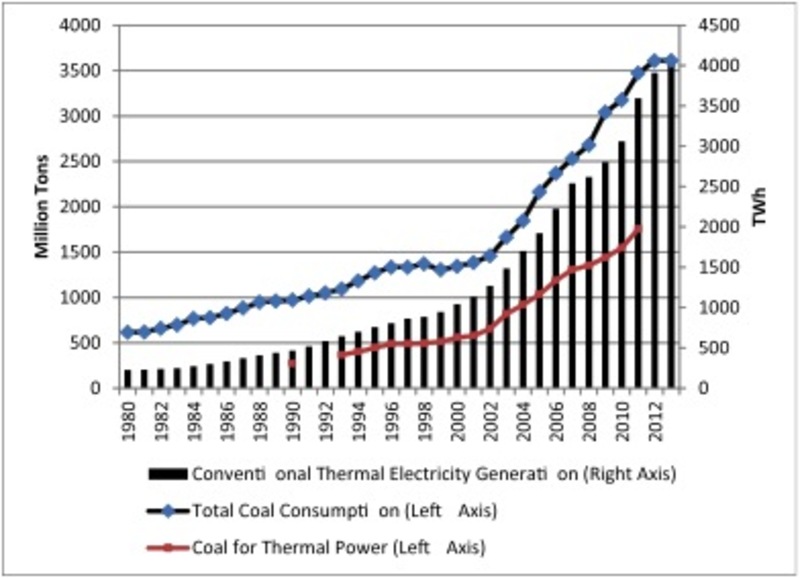
We need to sketch in the background to China’s energy revolution, so that the enormity of its commitment to renewables may be appreciated. We can see firstly how China continues to expand its ‘black’ energy system based on fossil fuels, and particularly coal, for its electric power generation. We show the situation updated to 2013 in Figure 1, where the relentless rise in the size of the fossil-fuelled power generation system is clearly shown, and the rising dependence on coal. While coal for thermal power continues to rise, the overall consumption of coal appears to be ‘capped’ at 3,500 million tonnes – a desperate measure taken no doubt in response to the blackening skies and poisoning of water and air.
The year 2001 is the inflection point – which coincides with China’s entry to the World Trade Organization (WTO). This signalled to the world that China was “open for business” and manufacturing started to migrate to China in a big way – calling for drastic expansion of the energy system. In the time-honored way, replicating the actions of the West in the 19th century, what was expanded initially was the coal-burning system.
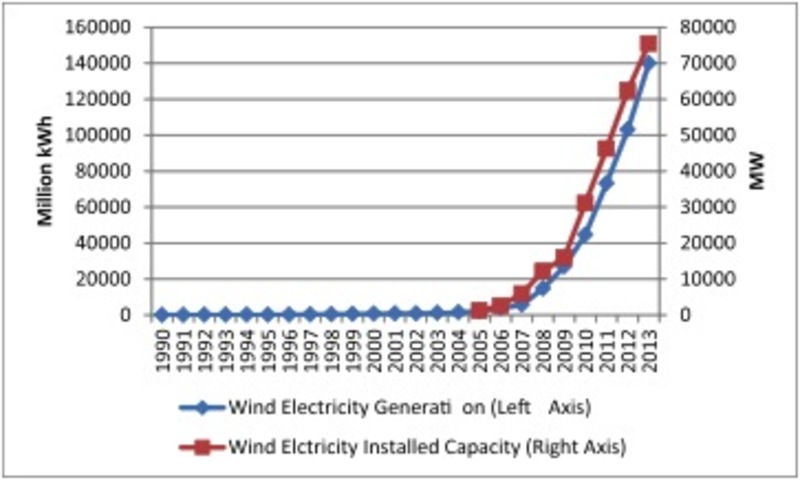
But the build-up in thermal (coal-fired) power has been complemented by the rise of renewables. The situation with wind power and its historic rise in terms of both capacity added (right axis) and electric energy generated (left axis) is shown in Fig. 2.
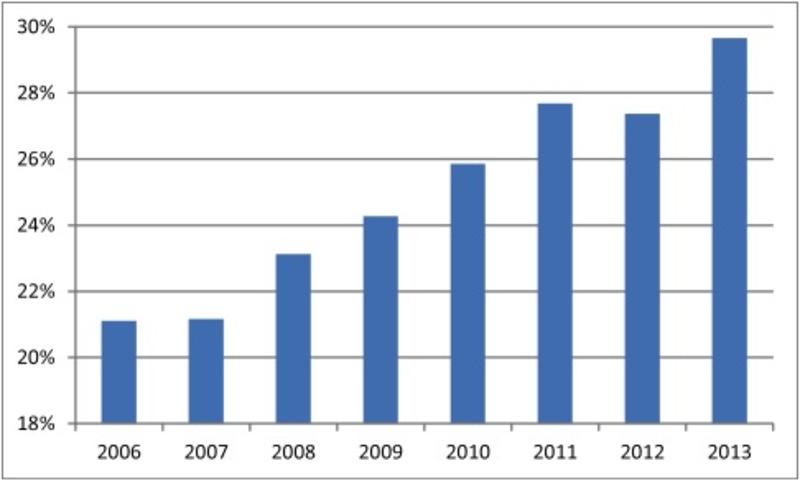
In just the space of eight years, China has become the world’s most important generator of wind power, with the world’s largest capacity and the largest addition of new power capacity in the year 2013. The increase in all three sources of renewables – hydro, wind and solar PV – is shown in Fig. 3, in terms of the proportion of power generated by renewables and its relentless rise (apart from a dip in 2012, following world recession in 2011).
The proportion reached by 2013, of close to 30% of electrical energy generated from renewable sources (hydro, wind and solar), is what gives China its international influence in renewables – and it demonstrates a relentless trend towards greater reliance on manufacturing systems for production of, e.g. wind turbines and solar cells, as opposed to the reliance elsewhere on alternative fossil fuels such as coal seam gas and shale oil.
In fact the sharp turn to renewables increase can be located accurately at around 2005-06, as shown in Fig. 4, which extends the same data as in Fig. 3 back in time to 1980. The sharp rise in renewables reflects particularly the new commitment to wind power – and it looks set to continue through industrial logistic dynamics. We will develop an argument below for the significance of this date.
Now let us look at the most recent data for the full-year 2013 – updating our own work as well as that of others who have been critical of us (such as Armond Cohen of the Clean Air Task Force). We have three sources of data to utilize in demonstrating how China’s electrical power system continues to green itself. We have the data on electrical capacity (measured in terms of gigawatts, GW); the data on electrical energy generated (in terms of billion kWh); and the data on investment. While each source of data is provisional at this stage (and there are some inconsistencies where we need to make compensating assumptions, which we will identify), the trend is clearly in line with the overall trends shown in Figs 2, 3 and 4 above.
Capacity is the most easily available and comprehensible source of data – just how many power stations is China building and how powerful are they? The weakness in this source of data is that coal-fired and nuclear power stations tend to produce more electricity than wind power or solar power of the same capacity. These differences, embodied in different “capacity factors”, mean that electrical energy produced is a better measure of how the system is travelling – but we don’t have complete data on this for 2013 as yet. Finally, investment data give an unarguable sense of where the system is headed.
1. Electric power capacity
In terms of generating capacity, China added a total of 94 billion watts (GW) in 2013, of which 55.3 GW came from renewable WWS sources (Water, Wind, Solar) and 36.5 GW from thermal (mostly coal) sources; China also added just 2.2 GW from nuclear sources.3 Thus just under 60% of China’s newly added capacity came from WWS sources, while just 40% came from non-renewable fossil fuels or nuclear.
By contrast, the US is getting into deeper dependence on fossil fuels, in particular coal seam gas secured by horizontal drilling and hydraulic fracture (fracking). The US added just 16 GW in 2013, with Natural Gas being the main contributor, at 7.3 GW. All told, the US added 8.8 GW (55%) from thermal/fossil fuel sources, and just 5.9 GW from WWS sources (under 37%) – with solar PV outranking wind as source for the first time. (Reports from the US emphasizing the increase in solar have ignored the greater contribution made by gas.) The main trend in the US is clearly towards coal seam gas and fossil fuels rather than towards renewables.
These new capacity additions show where the total electric power generating system is headed. In the US the system is further concentrating fossil fuel (thermal) dependence, now reaching a level of 74.5%, compared with just 14.3% for WWS sources (and 9.3% for the historic nuclear role). For China by contrast the system is further enhancing the role of renewables, now reaching just under 30% for WWS, compared with 69% for thermal and 1% for nuclear. The situation for the total electric power system and the new capacity additions in 2013 is shown in Table 1. Of course the 69% dependence on coal is still a huge ‘black’ energy commitment that is contributing mightily to the black skies over China. No wonder there is such strong commitment to a green alternative. (The target of 30% renewables in the electric power system was set for 2015 as part of the 12th Five Year Plan; it has been reached three years earlier than anticipated.)
Table 1. China and the US: Total electric power system and new capacity additions in 2013
| US: Installed capacity by the end of 2013 | US: New capacity added in 2013 | China: Installed capacity by the end of 2013 | China: New capacity added in 2013 | |
| Total (GW) | 1159 | 15.7 | 1247 | 94 |
| Thermal Power (GW) | 864 | 8.9 | 862 | 36.5 |
| Thermal/Total Power Capacity | 74.5% | 56.6% | 69.1% | 38.8% |
| WWS (GW) | 166 | 5.9 | 370 | 55.3 |
| WWS/Total Power Capacity | 14.4% | 37.3% | 29.7% | 58.8% |
| Nuclear power (GW) | 107 | 0 | 14.6 | 2.2 |
| Nuclear/Total Power Capacity | 9.3% | 0 | 1.2% | 2.4% |
Source: based on data available at the China Electricity Council (www.cec.org.cn) and FERC
2. Electrical energy generated
China’s total electricity generated in 2013 amounted to 5322 billion kWh (TWh), including 3959 TWh from coal power stations (74%), 896 TWh from hydro power stations, 140 TWh from wind, 8.7 TWh from solar PV, 112 TWh from nuclear, and the rest from other sources. This means that the vast electric energy ‘ship’ in China is being steered to a new renewables trajectory, with WWS sources now accounting for 20% of the electricity generated (1045 TWh). The official target from the NDRC in China is for this proportion to rise to 30% by 2020 – a target that shows every likelihood of being reached.
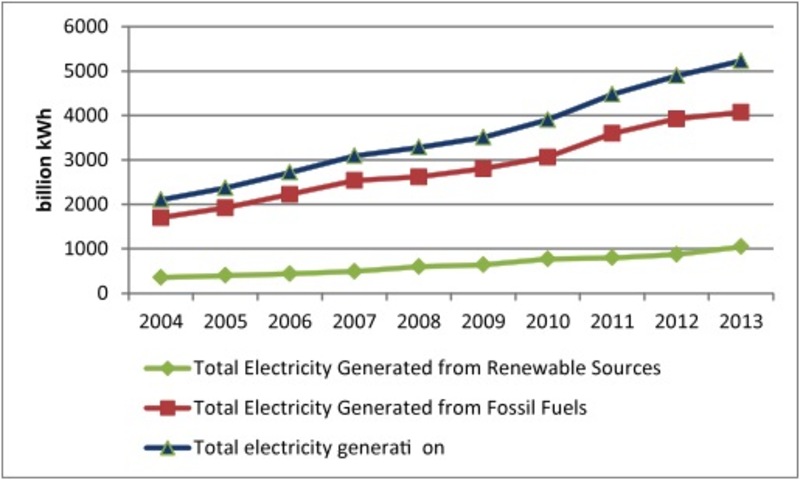 Figure 5. China: Electrical energy generated, 2004-2013Source: data up to 2011 available from the US EIA, data for 2012 and 2013 available from the China Electricity Council Figure 5. China: Electrical energy generated, 2004-2013Source: data up to 2011 available from the US EIA, data for 2012 and 2013 available from the China Electricity Council |
The figure for coal-generated electricity in 2013, standing at 74% is very important, and a needed corrective to the widely cited view that ‘Around 80% of China’s electricity generation is coal-fired’.4 The figure for WWS sources accounting for more than 20% in 2013 is also very important. The trends in these data over time are shown in Fig. 5. There is clearly a shift both towards renewables and towards the imposition of greater efficiency measures to cut wasteful energy consumption.
Now the China Electricity Council has issued through its website only partial data for 2013, drawing attention to percentage increases in various sources rather than giving the absolute numbers. (These numbers will arrive in due course; for the moment we have to make educated estimates.) In relying on total electrical energy generated, there are two main approaches – to rely on figures published for actual electrical energy generated (based on percentage increases year on year), and to rely on capacity additions corrected by “capacity factors” for the different generating potential of different sources.
Now some American critics of our work on China’s energy revolution have fastened on these points, and seek to demonstrate that China is far more dependent on fossil fuels for its power than it really is. Armond Cohen, for example, criticized our work (without attributing it to us by name!) by carrying the following chart (our Fig. 6) and text.5
Cohen states: “Once again, in 2013, coal was the big winner. As the graph below shows, when adjusted for capacity factor (the amount of energy each Gigawatt of capacity puts out in a year), it’s clear that newfossil energy output in China, most of it coal, exceeded new wind energy by six times and solar by 27 times:
What Cohen did here, apart from misrepresent us as to additional power added and total system power (on which more in a moment), has been to take the capacity additions in 2013 (up to October) and translate these into “putative” generation according to the capacity factors shown, calling the result “new electric production capability”. We prefer “putative generation” since that is what it is. We can update Cohen’s chart in two ways – by including the most recent Chinese estimates for capacity factors, and by showing the whole year data in place of the first ten months. Our own version of Cohen’s chart, suitably updated in these ways, is shown as Fig. 7, drawing data from Table 2.
Table 2 Electric capacity addition from renewable sources and their putative electric generation in 2013, China
| Technology of electricity generation | Capacity Added in 2013 (GW) | Average Utilization Hours per Year (hours)* | Putative Electricity Generated based on the average utilization hours (TWh) | Putative Electricity Generated based on the capacity factors suggested by IEA WEO (2013) (TWh)** | Increase in electric generation by sources in 2013 (TWh) **** |
| Thermal power | 36.5 | 5012 | 183 | 185.4 | 147.8 |
| Hydroelectricty | 30 | 3318 | 99.3 | 89.1 | 40.2 |
| Wind power | 14 | 2080 | 29.2 | 40.6 | 37 |
| Solar | 11.3 | 1314** | 14.8 | 14.8 | 5.1 |
| Nuclear | 2.21 | 7893 | 17.4 | 17.4 | 13.7 |
| Total 94 | 344 | 347.5 | 243.8 | ||
Notes
* based on data provided in the CEC except the capacity factor for solar. ** Assumed capacity factors based on IEA WEO 2013: fossil (58%); hydro (34%); wind (33%); solar (15%)
*** calculated based on the assumed capacity factor 15%4,
**** numbers in this column should not be compared with those in the two other columns as those reflect rather capacity addition in the previous year as well as changes in capacity factors.
Using the capacity factors to produce “putative generation” for the year 2013, whether the capacity factors are those of the IEA or those of the CEC in China, does not make much difference (Fig. 7)
 [Fig. 6] New Electric Production Capability Added in China During 2013 [Fig. 6] New Electric Production Capability Added in China During 2013(Terawatt Hours)Source: CATF from China National Energy Administrationwebsitefor GW, accessed January 2014. Assumed capacity factors: fossil (58% per IEA WEO 2013); hydro (34% per IEA WEO 2013); wind (33%); solar (15%).” |
Fig. 7 shows there is little difference in the two approaches. Fossil-fuelled electrical energy is around 180 billion kWh, while the total for hydro, wind and solar PV (water, wind and solar) is around 140 billion kWh, and nuclear comes in at just under 20 billion kWh (shown in Fig. 8). One can interpret this from two perspectives. One can emphasize that China is still adding more fossil-fuelled electrical generating potential than from low-carbon sources (the Cohen perspective) or that China is adding a remarkable level of renewables generation and one which is consistent with a swing towards renewables and away from fossil fuel dependence (our own perspective).6
The critical “deciding factor” is provided by new data on investment.
3. Investment trends
Expenditure in building new power generating infrastructure can reveal more than data on capacity and generating additions. The CEC has released investment data for 2013, which reveal the following trends. In terms of investment, China spent more on its grid in 2013 than on new power generation facilities. Investment in 2013 in total power generation and grid upgrading was RMB 761 billion (US$124 billion). Grid upgrading accounted for RMB 389 billion (US$63.5b), while new power generation capacity was RMB 372 billion (US$60.7b). The significance of this is that China is spending on infrastructure to accommodate more renewable power facilities, as well as on the facilities themselves. Of the new generation facilities, investment in new energy sources accounted for more than 40% of the total investment in new power generation facilities, including RMB 125b on hydroelectricity, while new investments in thermal sources (mainly coal) amounted to only RMB 93b (25%). So WWS clearly outranked thermal sources in terms of new investment in 2013 – another important clue as to future directions.
In terms of ‘smart grid’ (IT-enabled grid), China outspent the US for the first time in 2013: US$4.3b compared with US total of $3.6b (down 33% on 2012), and world total of $14.9b (up 5% on 2012). (Click here for Bloomberg on China’s Energy Efficiency)
 Fig. 7 China’s putative generation of electrical energy in 2013 Fig. 7 China’s putative generation of electrical energy in 2013 |
Thus our conclusion that in 2013, China’s leading edge of change in its electric power system is now more “green” than “black”. We have demonstrated above that this is unambiguously so in terms of capacity added and in terms of investment, while in terms of new generation of electrical energy thermal still marginally outranks renewables (180 billion kWh generated to 160 billion kWh).
“Leading edge” versus total system change
We emphasize that all along we have been making a clear distinction between the state of China’s total energy system (in particular the electric power system) and its leading edge of change, as captured in the 2013 full-year data. China’s is a very large electric power system – as noted, now larger than that of the US. In terms of the slow-moving total system, China now has 30% of its generating capacity sourced from renewables, and 20% of its total electrical energy generated sourced likewise from renewables. (The difference is due to the lower capacity factors of renewable generating sources – themselves improving year by year.) By contrast, at the leading edge, for the year 2013 alone, China added 94 GW of new capacity, of which 55.3 GW came from renewables (59%), and just 36.5 GW (or 39%) came from thermal sources – a dramatic reversal of past trends; while in terms of electrical energy generated in the past year, 148 billion kWh came from thermal sources (60%) while 82 billion kWh came from renewables (33%). The leading edge is clearly greener than the total system, which is why we can predict the direction of change of the total system as moving towards greater reliance on renewables.
Cohen makes an elementary error in trying to pin on us the claim that China’s overall energy system is becoming more dependent on renewables than on fossil fuels. Just so that there can be no misunderstanding now, we insist that it is sheer misrepresentation to take our analysis as being anything other than it is – a picture of where the total system is headed based on its leading edge of change.7
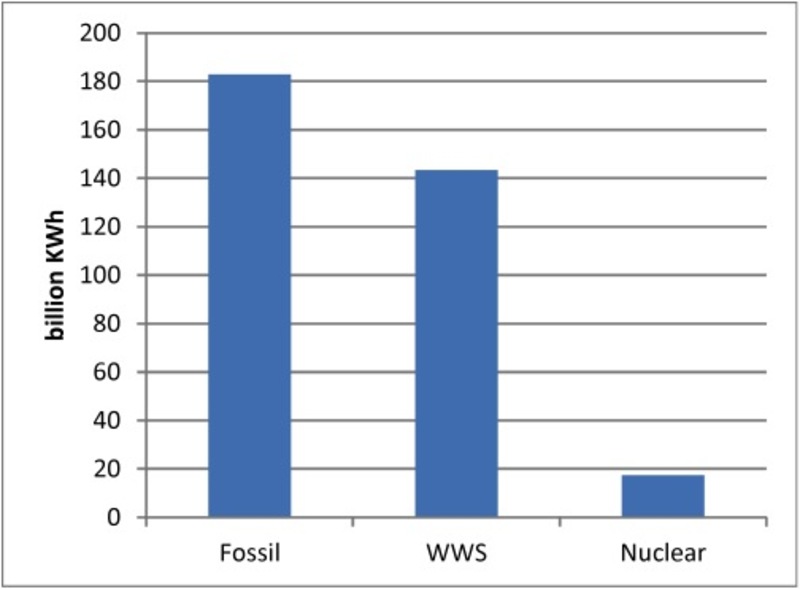 Fig 8. China’s putative generation of electrical energy in 2013: Fossil fuels vs. WWS (based on the average hours in 2013 provided by the CEC) Fig 8. China’s putative generation of electrical energy in 2013: Fossil fuels vs. WWS (based on the average hours in 2013 provided by the CEC) |
Future trend in carbon emissions
What are the implications for carbon emissions? The CEC reports that in 2013 China’s coal consumption was 321 grams per kWh electricity generated. Taking the electricity generated from coal as the relative benchmark (5322 TWh), this indicates that coal consumed in electric power generation in 2013 was 1.27 billion tonnes coal (Gt). This is the total that China’s energy policy is targeted at reducing as fast as possible – through both the build-up of renewable sources and through improved efficiency in coal conversion. Total coal consumption from all sources (power generation as well as industrial) in China is expected to be 3.8 Gt coal – so that coal consumed in power generation is now less than half the overall total. China’s dependence on coal is to be reduced to less than 65% in 2014, bringing forward the original target of 2017 (Click here for Bloomberg on Smog and Green initiatives in China)
Perhaps (here we speculate) the reason that commentators like Cohen are so keen to misrepresent us is that they do not like the implication of our analysis that China’s carbon emissions are set to peak and then to fall – and fall faster than in the US or in Europe.
The motives
Finally, we need to ask what are the motives for China’s dramatic shift to a renewables trajectory? The common assumption is that it is concern over climate change (global warming) that drives the shift. Important as this motive is, we believe it is the least likely of the explanations for China’s shift. We believe the more plausible explanation for China’s new trajectory – and for the determination with which it is being pursued – is energy security and industrial development.
The immediate motive for China’s push towards renewables is of course the scandal of the smog-blackened skies and polluted water that are making the air unbreathable and life unliveable in the major cities. Scarcely a week goes by without some new story of terrible air pollution in Beijing, or Dalian or Tianjin or some other major industrial centre. The Chinese leadership have to breathe the same air – at least up to a point (bearing in mind the ‘bubble’ that they mostly inhabit). And this is clearly a powerful motivator in the drive to develop an energy system less reliant on ‘black’ fossil fuels and more on ‘green’ renewables. Christina Larson was certainly on the mark with her comment on the paradox of China’s “green energy and black skies” (Click here for Larson on China’s energy paradox).
In the medium-term, renewables offer China energy security in a way that continued reliance on fossil fuels (particularly imported coal and oil) cannot possibly offer. Every country is faced with a choice between, on the one hand, continued reliance on fossil fuels, with their geopolitical implications and threat of military entanglements, and on the other an increasing reliance on renewables, which are based on manufacturing activities. As China industrializes, and becomes the new workshop of the world, so an ever larger share of its increasing energy needs can be met by manufacturing activities such as production of wind turbines and solar PV cells. So long as China is able to tap renewable sources of energy for these manufactured devices to work on (solar and wind energy) it can generate superior energy security through renewables than it can through continuing (or deepening) its reliance on fossil fuels.
The other medium-term motive is to build new industries around green sectors, as the foundation for export industries of the future. It is notable that in the 12th Five Year Plan (covering the years 2011 to 2015) low-carbon and cleantech industries have been placed at the core of China’s growth strategy, with the new sectors (covering renewables, grip upgrading and “new energy” vehicles) are expected to account for 15% of GDP by 2015, with support from public innovation spending of 2.0 to 2.5% of GDP by 2015.
So the fundamental motivation for China’s shift towards renewables, as we see it, is that renewables represent a means of expanding energy supplies based on expansion of manufacturing activities and their supply chains – something that China is very good at – rather than on expanding extractive industries for fossil fuels around the world and securing them with military force. The renewables option builds on manufacturing and the increasing returns it generates; the fossil fuels option builds on extractive activities and their diminishing returns, with all the potential for military entanglements that they represent. The renewables option is consistent with a smart business strategy for creating both jobs and export platforms for green products as the core of China’s future development strategy.
The Chinese leadership had just made the decision to enter the WTO and expand its energy system through expansion of coal and oil, when along came the attacks on the NY Trade Center in September 2001 – making it clear to the Chinese leadership that fossil fuels represented a risky option that could be the target of terrorist attacks. The decision to go seriously with renewables was taken shortly after those events – and the change in investment patterns and build-up in renewables capacity that is visible in the statistics around 2005 is the direct consequence of these decisions. If this argument is correct, it was not global warming that was the driver, but energy security as well as industrial development.8
It is a fact that China is building wind farms and solar power farms on a greater scale than anywhere else – while building the complementary industrial capacities for producing wind turbines, solar cells as well as other renewable energy equipment (such as lenses and mirrors for concentrated solar power) on a scale that far exceeds commitments in any other country. China is serious in its pursuit of renewables, because it seems to believe that its future prosperity depends on building the industries that produce power – complementing its activities in searching for fossil fuels supplies all around the world. There is a lesson here for all other developing countries, and notably for India and Brazil. And not only developing countries.
John Mathews, Macquarie Graduate School of Management, Macquarie University, Sydney NSW 2109, Australia and Eni Chair in Competitive Dynamics and Global Strategy, LUISS Guido Carli University, Viale Romania, 32 00197 Roma, Italy.
Hao Tan, Newcastle Business School, University of Newcastle, Australia.
This article was originally published on The Asia-Pacific Focus. Reproduced here with permission.
