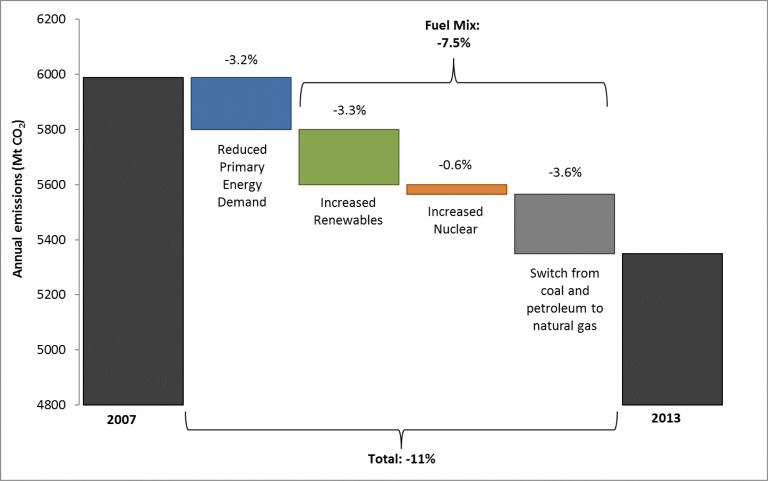
After a nearly 20-year upward trend, U.S. CO2 emissions from energy took a sharp and unexpected turn downwards in 2007. By 2013, the country’s annual CO2 emissions had decreased by 11% – a decline not witnessed since the 1979 oil crisis.
Experts have generally attributed this decrease to the economic recession, and to a huge surge in cheap natural gas displacing coal in the U.S. energy mix. But those same experts mostly overlooked another key factor: the parallel rise in renewable energy production from sources like wind and solar, which expanded substantially over the same 2007-2013 timeframe.
Wind energy led this growth, increasing 370% from 340 MMBtu (million British Thermal Units) in 2007 to 1,600 MMBtus in 2013. Bioenergy grew 34% (from 3500 to 4700 MMBtus)and solar energy increased over 700 percent (a more modest increase in absolute terms, from 60 to 430 MMBtus).
Given these increases, how much did renewables contribute to the emissions reductions in the United States? In a paper published this week in the journal Energy Policy, we use a method called decomposition analysis to answer just that.
Unpacking the Factors
Decomposition analysis is an established method which enables us to separate different factors of influence on total CO2-emissions and identify the contribution of each to the observed decrease. The factors considered here are total energy demand, the share of gas in the fossil fuel mix (capturing the switch from coal and petroleum to gas), and the share of renewables and nuclear energy in total energy production.
Introducing a new approach for separately quantifying the contributions from renewables, we find that renewables played a crucial role in driving U.S. energy CO2 emissions down between 2007 and 2013 – something which has previously largely gone unrecognized.
According to our index decomposition analysis, of the total 640 million metric ton (Mt) decrease (11%) during that period two-thirds resulted from changes in the composition of the U.S. energy mix (with the remaining third due to a reduction in primary energy demand). Of that, renewables contributed roughly 200 Mt reductions, about a third of the total drop in energy CO2 emissions. That’s about the same as the contribution of the coal and petroleum-to-gas switch (215 Mt). Conversely, increases in nuclear generation contributed a relatively minor 35 Mt.
While the significant role of renewables in reducing CO2 emissions does not diminish the contribution of the switch to natural gas, it is important to note that the climate benefits of switching from coal and petroleum to gas are undermined by the presence of methane leakage along the natural gas supply chain, the extent of which is likely underestimated in national greenhouse gas (GHG) emissions inventories.
Methane, of course, is a powerful greenhouse gas. Methane leakage from increased natural gas use could have wiped out up to 30% of the short-term GHG benefit (on a CO2-equivalent basis) calculated in this paper of switching from coal and petroleum to natural gas. For the natural gas industry to truly sustain the claim that it has made a positive contribution to reducing the country’s carbon footprint, the methane emissions associated with natural gas must be substantially reduced.
These results show that past incentives to support the expansion of renewable energy have been successful in reducing the country’s emissions, and that decreasing costs for renewable energy offers some hope for continued progress even despite the current administration’s refusal to address climate change.
Such progress, however, will never be sufficient without ambitious climate and clean energy policies- whether at the federal or at the state level – that can drive further emission reductions.
This blog was co-authored with Jonathan Camuzeaux, Adrian Muller, Marius Schneider and Gernot Wagner.


